REW's "wavelet" mode shows us a particular filtered wavelet transform graphical view which makes it easier to see certain details/aspects of the measured IR normally not obvious by just looking at the steady state curves. Unlike the Fourier mode, the time spread appears to us more intuitively/naturally because it already applies a form of frequency-dependent windowing -- where higher frequencies develop in a much shorter amount of time and lower frequencies for longer amounts of time.
https://drc-fir.sourceforge.net/doc/drc.html#sec242
Using a higher resolution setting in the spectrogram increases the magnitude contribution/bias while lower resolutions decrease the magnitude bias in favor of time. The default can be okay as your starting point, but I would change or cycle between different settings (including time scales e.g. 50ms vs 200ms) along the way. If I were mainly interested about the peak energy time, for example, I would use "Linear (% peak)" from the drop-down amplitude settings.
Resonances may appear more clearly as vertical "streaks" and reflections as horizontal streaks. Our rooms are rather complicated, though, so the graph usually appears even more "busy" or splotchy than some of the examples shown in the REW manual. Additionally, one can also visualize pre-ringing and/or pre-echo artifacts e.g. small ripples and/or long curved streaks appearing right before t=0 if using FIR "correction" wrongly/excessively -- for this, I use 1/2 or 1/3 resolution.
Depending on what filtering is used, a correlation can be seen more clearly between the GD curve and wavelet's peak energy time as well.
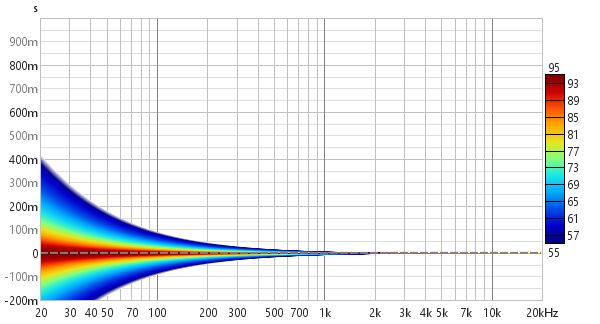
The ideal, perfect "dirac delta" impulse response would be like this (REW wavelet mode):
example from REW manual
or even like this (step response):
example from
DRC documentation
You can get something closer to this "perfect ideal" if you listen outdoors well-away from boundaries or move into an anechoic chamber.

From your graphs, we can see that the peak energy time flows very evenly, however, not quite "transient perfect" as would be the case when everything's aligned exactly at t=0. This isn't normally an issue as long as there isn't any excessive discontinuity, smearing/streaking, and/or splotchiness (from delayed-reflected higher magnitude SPL energy) seen over time.
The more you compare between REW's different views, it should eventually become easier to see how the clarity curves -- C50, C80, and D50 -- and other graphical views such as spectral decay and RTx correlate with each other.