• WANTED: Happy members who like to discuss audio and other topics related to our interest. Desire to learn and share knowledge of science required. There are many reviews of audio hardware and expert members to help answer your questions. Click here to have your audio equipment measured for free!

Klipsch R-41M Bookshelf Speaker Review

tuga

Major Contributor
Joined
Feb 5, 2020
Messages
3,984
Likes
4,285
Location
Oxford, England
Again, that is because you have no experience in this field. Symmetric placement of AB speakers is poor man's version of putting both speakers in the same spot which requires a mechanical shuffler.

Instead of constantly complaining, maybe you outline how you are testing speakers according to whatever science you are imagining.

Do you high-pass the speakers?
 

QMuse

Major Contributor
Joined
Feb 20, 2020
Messages
3,124
Likes
2,785
You are trying to convince me that by listening to a single speaker playing pink noise (steady state sound) you are able to hear a driver resonance that doesn't produce an obvious peak in the FR response or that the bass reflex alighnment is uderdamped, or that a midbass cone is not particularly good at reproducing low-level detail.

You won't be able to hear resonance that doesn't produce an obvious peak in the FR no matter what you listen.

"Particularly good at reproducing low-level detail" is a subjective undefined cathegory so it makes no point discussing it. How can speaker with decent spinorama be missing "low-level details"???

You are not willing to accept arguments yet you offer no technical explanation for doing so.
 

tuga

Major Contributor
Joined
Feb 5, 2020
Messages
3,984
Likes
4,285
Location
Oxford, England
All peaks in FR are coming from some kind of resonances hence they all fall into "tonal balance" cathegory. :)


Reproduction of sharp transients found in music (like cymbals, etc) is also about even FR (tonal balance). People just use different words when describing disbalance ("harsh", "snappy", etc).

I am talking about audibility when reproducing steady state pink-noise over a single speaker not about about the computer analysis of a swept-sine signal...
It's all very easy once you've looked at some on- and off-axis measurements.

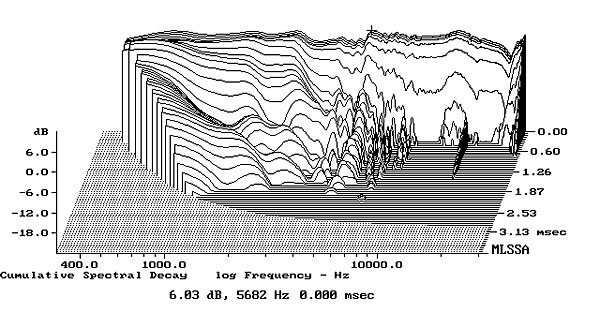
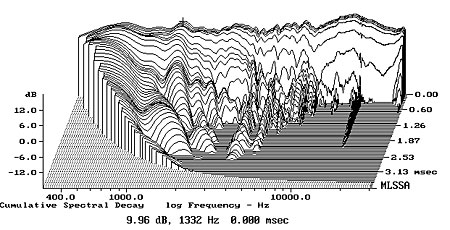
A resonance may produce a low-level high Q blip in the FR but can ring for a relatively long period. This can sound very unpleasent when it happens in the presence region.
These might not be the best examples because the resonances are rather low in level but I'm sure you get the picture:

217MagS52fig7.jpg

708Revfig10.jpg
 

pma

Major Contributor
Joined
Feb 23, 2019
Messages
4,603
Likes
10,771
Location
Prague
Again, that is because you have no experience in this field. Symmetric placement of AB speakers is poor man's version of putting both speakers in the same spot which requires a mechanical shuffler.

Instead of constantly complaining, maybe you outline how you are testing speakers according to whatever science you are imagining.

1) "Symmetric placement of AB speakers ....." cannot exclude different acoustic conditions in both placements, including reflections.
2) would you stop personal invective like "that is because you have no experience in this field". Contrary to you, I graduated in electroacoustics.
 

QMuse

Major Contributor
Joined
Feb 20, 2020
Messages
3,124
Likes
2,785
I am talking about audibility when reproducing steady state pink-noise over a single speaker not about about the computer analysis of a swept-sine signal...
It's all very easy once you've looked at some on- and off-axis measurements.

A resonance may produce a low-level high Q blip in the FR but can ring for a relatively long period. This can sound very unpleasent when it happens in the presence region.
These might not be the best examples because the resonances are rather low in level but I'm sure you get the picture:

217MagS52fig7.jpg

708Revfig10.jpg

Those 2 graphs are totlly meaningless without putting them in the relation with FR. What exactly can are you trying to read from them??

And once again, why would I be looking at them when I have spinorama charts unless I'm a speaker designer/builder so I need to understand a resonant issue in order to rectify it?
 

tuga

Major Contributor
Joined
Feb 5, 2020
Messages
3,984
Likes
4,285
Location
Oxford, England
You won't be able to hear resonance that doesn't produce an obvious peak in the FR no matter what you listen.

"Particularly good at reproducing low-level detail" is a subjective undefined cathegory so it makes no point discussing it. How can speaker with decent spinorama be missing "low-level details"???

You are not willing to accept arguments yet you offer no technical explanation for doing so.

This may be difficult to try unless you have access to different speakers but, if you do, try to reproduce a complex orchestral passage over a few of them (one speaker at a time might work better) at very low levels. Some will still reproduce a lot of detail whilst others mask some of it.
"Hard" cones are usually better at this than say some polypropylene drivers.
 

QMuse

Major Contributor
Joined
Feb 20, 2020
Messages
3,124
Likes
2,785
This may be difficult to try unless you have access to different speakers but, if you do, try to reproduce a complex orchestral passage over a few of them (one speaker at a time might work better) at very low levels. Some will still reproduce a lot of detail whilst others mask some of it.
"Hard" cones are usually better at this than say some polypropylene drivers.

Are you saying that such difference won't show in FR taken at that low level but you would still be able to hear it? Even in a properly conducted blind test? I don't think so.
 

tuga

Major Contributor
Joined
Feb 5, 2020
Messages
3,984
Likes
4,285
Location
Oxford, England
Those 2 graphs are totlly meaningless without putting them in the relation with FR. What exactly can are you trying to read from them??

And once again, why would I be looking at them when I have spinorama charts unless I'm a speaker designer/builder so I need to understand a resonant issue in order to rectify it?

The on-axis FR is in those graphs.
I can see that the decay over the plotted spectrum is not uniform.

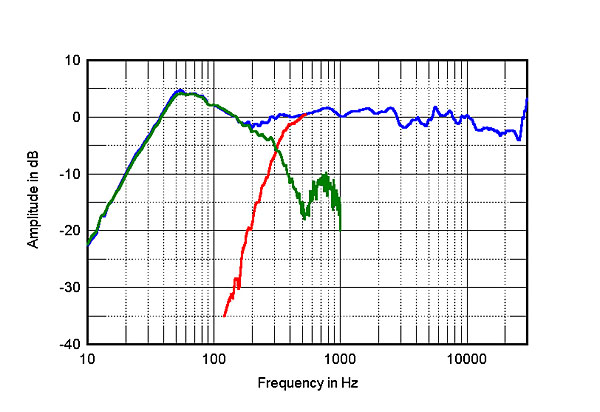
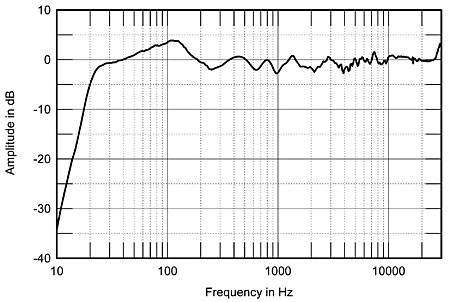
Listening window FR as per Sphile:

217MagS52fig2.jpg


708Revfig04.jpg
 

Frank Dernie

Master Contributor
Forum Donor
Joined
Mar 24, 2016
Messages
6,454
Likes
15,807
Location
Oxfordshire
If a speaker measures very well then theoretically you could use a DSP to emulate the performance of this speaker or any other speaker.
A friend of mine did this about 20 years ago.
It was for his research, but for fun he measured his phone speaker.
It was bizarre to hear my 26Hz to 20kHz speakers sound like a phone.
I am sure it could be done much more accurately and cheaply nowadays, but it was pretty convincing back then.
 

Sancus

Major Contributor
Forum Donor
Joined
Nov 30, 2018
Messages
2,926
Likes
7,643
Location
Canada

tuga

Major Contributor
Joined
Feb 5, 2020
Messages
3,984
Likes
4,285
Location
Oxford, England
Are you saying that such difference won't show in FR taken at that low level but you would still be able to hear it? Even in a properly conducted blind test? I don't think so.

You don't think so.
 

QMuse

Major Contributor
Joined
Feb 20, 2020
Messages
3,124
Likes
2,785
I can see that the decay over the plotted spectrum is not uniform.

It never is. But real question is how much of that is audible? It makes no sense to continue this, you are failing to understand that if such artefacts are audible you would be able to see them in FR.
 

Frank Dernie

Master Contributor
Forum Donor
Joined
Mar 24, 2016
Messages
6,454
Likes
15,807
Location
Oxfordshire
How can speaker with decent spinorama be missing "low-level details"???
If part of the good looking spinorama spectrum is actually due to cabinet radiation, not output from the drivers?
Only speculating but since enough speaker designers address cabinet radiarion as a priority and the spinorama, as far as I can see, is unable to separate sound emanating from the cabinet from sound emanating from the drivers.
Clearly a resonance will be seen, and probably heard, as a peak, but is it driver or cabinet related?
 

Francis Vaughan

Addicted to Fun and Learning
Forum Donor
Joined
Dec 6, 2018
Messages
933
Likes
4,697
Location
Adelaide Australia
This is the whole problem with the decay graphs. You read all sorts of stuff into them that it is not clear has any relation to audible phenomena. As has been noted before, everything you can see in the decay is encoded in the frequency response. There is some value in decay graph if you are looking for a specific feature during development, as it makes things easier to easier to see and determine the root cause. But in terms of final audible results the correlation is shaky. With experience you can guess what the decay looks like anyway.
 

QMuse

Major Contributor
Joined
Feb 20, 2020
Messages
3,124
Likes
2,785
If part of the good looking spinorama spectrum is actually due to cabinet radiation, not output from the drivers?
Only speculating but since enough speaker designers address cabinet radiarion as a priority and the spinorama, as far as I can see, is unable to separate sound emanating from the cabinet from sound emanating from the drivers.
Clearly a resonance will be seen, and probably heard, as a peak, but is it driver or cabinet related?

I agree, good looking spinorama spectrum is a sum of everything coming from the speaker: drivers, ports, cabinet, etc. My point was why should I care where does the resonance come from? I won't buy that speaker when I see a resonance in spinorama and I can't do anything to correct it, so why bother?
 

tuga

Major Contributor
Joined
Feb 5, 2020
Messages
3,984
Likes
4,285
Location
Oxford, England
Hard to imagine how that makes it any less "scientific" than doing it sighted to begin with?

Blindness removes part of the bias, that's all. It is not a synonym of scientific in any shape or form.

A listening test methodology has to be fit for purpose, otherwise it's worthless.
 

tuga

Major Contributor
Joined
Feb 5, 2020
Messages
3,984
Likes
4,285
Location
Oxford, England
This is the whole problem with the decay graphs. You read all sorts of stuff into them that it is not clear has any relation to audible phenomena. As has been noted before, everything you can see in the decay is encoded in the frequency response. There is some value in decay graph if you are looking for a specific feature during development, as it makes things easier to easier to see and determine the root cause. But in terms of final audible results the correlation is shaky. With experience you can guess what the decay looks like anyway.

Perhaps you could try to stabilise that correlation.
 

Francis Vaughan

Addicted to Fun and Learning
Forum Donor
Joined
Dec 6, 2018
Messages
933
Likes
4,697
Location
Adelaide Australia
If part of the good looking spinorama spectrum is actually due to cabinet radiation, not output from the drivers?
Only speculating but since enough speaker designers address cabinet radiarion as a priority and the spinorama, as far as I can see, is unable to separate sound emanating from the cabinet from sound emanating from the drivers.
Clearly a resonance will be seen, and probably heard, as a peak, but is it driver or cabinet related?
You would have a pretty good idea just from the nature of the peak. A resonance from the driver would be known a priori anyway. Panel or acoustic resonance inside the box are not hard to pick. A single quick tweak to the prototype and you will know.
 

napilopez

Major Contributor
Forum Donor
Joined
Oct 17, 2018
Messages
2,146
Likes
8,718
Location
NYC
The on-axis FR is in those graphs.
I can see that the decay over the plotted spectrum is not uniform.

Listening window FR as per Sphile:

217MagS52fig2.jpg


708Revfig04.jpg

You can see this without a CSD though. On and off axis data is enough.


If part of the good looking spinorama spectrum is actually due to cabinet radiation, not output from the drivers?
Only speculating but since enough speaker designers address cabinet radiarion as a priority and the spinorama, as far as I can see, is unable to separate sound emanating from the cabinet from sound emanating from the drivers.
Clearly a resonance will be seen, and probably heard, as a peak, but is it driver or cabinet related?

It's an interesting topic that seems to be intrinsically tied to the Q of the resonance. Here's what Toole says in one part of his book:

"The key idea being communicated in Figure 4.10 is that neither the amplitude of the peak in the frequency response nor the duration of ringing is a reliable clue to the audibility of the resonances, at least above the transition frequency. It is counterintuitive. Adding damping reduces the Q, and therefore the ringing. It also reduces the amplitude of the peak in the frequency response, all of which would seem to be good. But the peak is now much wider and is therefore more frequently energized by components of the program. This means that it will be more often heard; the threshold ends up being lower— this well-damped resonance is easily heard. In contrast, the Q = 50 resonance is energized only when a musical component is precisely at the right frequency and remains there long enough to allow it to accumulate energy— to build up— which is easily seen in the center column of data.

Toole, Floyd E.. Sound Reproduction (Audio Engineering Society Presents) (p. 80). Taylor and Francis. Kindle Edition. "

So even when trying to correct resonances, you have to be careful about how you go about it. Trying to correct a high Q resonance could very well create a more significantly more audible problem.

For the speaker designer, it seems the ideal approach is to simply minimize resonances altogether. But most people can't do that, so instead you try to make them as inoffensive as possible. One quite interesting approach I once saw was a speaker that seemed to use resonances to fill in the crossover dip. Or at least, that's what I think they were going for.
 
Top Bottom