This is a review and detailed measurements of the Harbeth Monitor 30 25th anniversary speaker. It is on kind loan from a local member. This specific speaker came out around 2002 I think and cost US $3,200 around that time. Being patterned after the famous BBC LS 5/9 speakers, I imagine the design is still the same to this day. The latest model seems to go by 30.1 designation.
The Harbeth logo was in danger of coming off so the owner pulled it off. Here is what it looks like (I know, very bland):

It barely fit in my little photo booth so not very large. The grill is tricky to remove so I did not attempt to do so. I am told the recommendation is to use it with the grill so that is how I measured it.
The back panel shows ability for bi-wiring:

Love the bit about the speaker being in their log book. Well, its measurements are now in our log book as well.")
Let's get into measurements. Since this is a passive monitor, I followed the CEA 2034 recommendation of feeding it 2.83 volts. Temperature was a balmy 57 degrees. Altitude was 13 feet above sea level. Acoustic center of the speaker was determined following ITC-2025 Part B standard (I used my Mitutoyo micrometer). Any wind in the lab was self-generated due to previous meal.
CEA-2034 Spinorama Measurements
As usual we start with our master dashboard of the speaker which is its "spin" data:

I have gotten requests for "clean" versions of this picture so I have avoided making notations on it. Let me know if that is a good or bad idea.
There is a lot of controversy around the so called "BBC dip" where around the crossover frequency the on-axis response drops fair bit. Tom Holman of the T in THX recommended that the same dip be implemented in Audessey Room EQ! A mistake in my opinion. Anyway, we see the dip starting around 3 kHz. Getting a 3-D plot of that region gives us this complex sound intensity:

I don't think this is what you want in a speaker. Put another way, it is the classic engineering work of calling a defect a feature. We can see the havoc it plays on our early window (and sound power) directivity:

Why would I want to have a suck out in that region of audible spectrum? I let you google forever to read the fights back and forth.
Taking into account the direct and early window reflections to predict the in-room response, we get:

The dip is there of course around the crossover frequency. And general unevenness. The overall tilt is quite exaggerated so perhaps good for people with high sensitivity to high frequencies, it would tame the harshness in that region in the recording.
Basic Speaker Measurements
Let's start with impedance and phase measurements:

Specification is 6 ohms. Standard requires staying about 80% (?) of this value which would be 4.8 ohm. If you cheat a bit it gets there. Worst case phase is around 100 Hz which impedance around 9 ohms. This make the effect load to be much lower (i.e. the difficulty that the amplifier sees).
Sensitivity ("efficiency") is almost always given as a single number by the manufacturer but it varies based on frequency:

In most of the frequency range the actual sensitivity is better than specified 85 dB which is good.
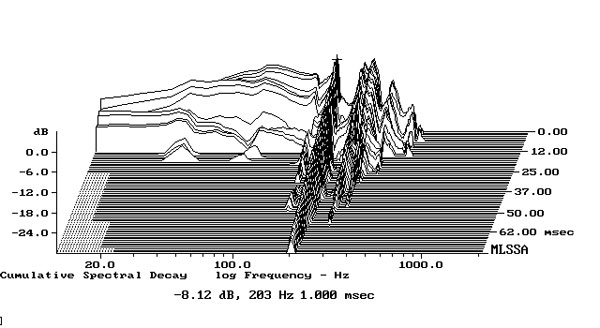
You all seem to like colorful 3-D graphs so here is the so called "waterfall:"

I don't trust this graph much. For one thing, these graphs can be manipulated to show any and all things. More importantly though, the Klippel NFS system I use is great for measuring frequency response but on tests like this, its structure can resonate with the speaker, which would show up as its own slices above. Maybe after I test more speakers I get confidence on reliability of this (rather useless) measurement.
Finally, step function seems to be a popular item so here it is, zoomed properly now to show the step response of each driver:

The tweeter is always "faster" so it generates a response first. It is swinging negative which means it is out of phase with the woofer which takes its time to generate its response to the right of it at opposite phase. There is discontinuity between the two (around 2.8 milliseconds).
Advanced Speaker Measurements
Here is the rest of the bits for those interested:


Full spin data is enclosed.
Correlation With Other Measurements
Stereophile measured a much more recent version and reported this for frequency response:
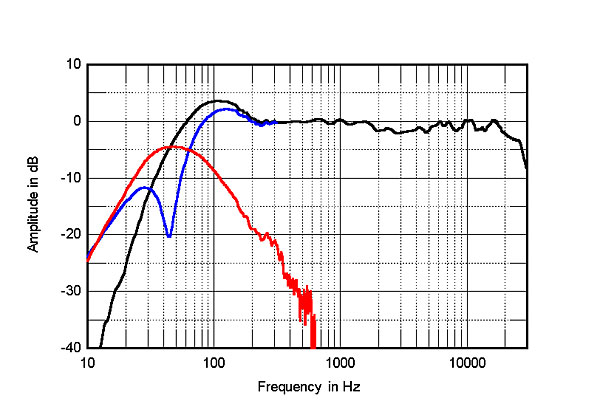
Focus on the black line only. It looks a heck of a lot better than our graph. Almost flat and smooth on Axis! Well, that is not what is really going on.
First the easy part, it has the same bass hump as we do (although their measurements usually exaggerates this due to their close-in measurement technique):
We show a dip post our peak in low frequency but they don't. The reason is that they are using gated measurements to eliminate echos and that hugely reduces resolution in a few hundred hertz (to one or two data points). Past that, they do have the dip but they show such a low resolution compressed graph that it is not nearly as visible. We both show the couple of peaks close to 10 kHz.
Overall, given the radically different measurement setups, I say the correlation is very good. Our data is much higher resolution than theirs.
Listening Tests
No time or setup yet for listening tests. Will do some and report back later.
Conclusions
It is interesting to measure these "classic" speakers to finally put some hard data behind their objective performance. As expected the halo is more positive than the objective data indicates. The cost of these speakers is way up there. I appreciate being built in England and needing to have good supply of bear for works after hours but it is a lot of money for this kind of measured performance.
------------
As always, questions, comments, recommendations, etc. are welcome.
Had some great sushi at my favorite spot when I went to pick this and other speakers. It was over US $60 for lunch! While I feel satisfied, I also feel poor. So please help lift my spirits by donating using: https://www.audiosciencereview.com/forum/index.php?threads/how-to-support-audio-science-review.8150/
The Harbeth logo was in danger of coming off so the owner pulled it off. Here is what it looks like (I know, very bland):
It barely fit in my little photo booth so not very large. The grill is tricky to remove so I did not attempt to do so. I am told the recommendation is to use it with the grill so that is how I measured it.
The back panel shows ability for bi-wiring:
Love the bit about the speaker being in their log book. Well, its measurements are now in our log book as well.
Let's get into measurements. Since this is a passive monitor, I followed the CEA 2034 recommendation of feeding it 2.83 volts. Temperature was a balmy 57 degrees. Altitude was 13 feet above sea level. Acoustic center of the speaker was determined following ITC-2025 Part B standard (I used my Mitutoyo micrometer). Any wind in the lab was self-generated due to previous meal.
CEA-2034 Spinorama Measurements
As usual we start with our master dashboard of the speaker which is its "spin" data:
I have gotten requests for "clean" versions of this picture so I have avoided making notations on it. Let me know if that is a good or bad idea.
There is a lot of controversy around the so called "BBC dip" where around the crossover frequency the on-axis response drops fair bit. Tom Holman of the T in THX recommended that the same dip be implemented in Audessey Room EQ! A mistake in my opinion. Anyway, we see the dip starting around 3 kHz. Getting a 3-D plot of that region gives us this complex sound intensity:
I don't think this is what you want in a speaker. Put another way, it is the classic engineering work of calling a defect a feature.
We can see the havoc it plays on our early window (and sound power) directivity:Why would I want to have a suck out in that region of audible spectrum? I let you google forever to read the fights back and forth.
Taking into account the direct and early window reflections to predict the in-room response, we get:
The dip is there of course around the crossover frequency. And general unevenness. The overall tilt is quite exaggerated so perhaps good for people with high sensitivity to high frequencies, it would tame the harshness in that region in the recording.
Basic Speaker Measurements
Let's start with impedance and phase measurements:
Specification is 6 ohms. Standard requires staying about 80% (?) of this value which would be 4.8 ohm. If you cheat a bit it gets there. Worst case phase is around 100 Hz which impedance around 9 ohms. This make the effect load to be much lower (i.e. the difficulty that the amplifier sees).
Sensitivity ("efficiency") is almost always given as a single number by the manufacturer but it varies based on frequency:
In most of the frequency range the actual sensitivity is better than specified 85 dB which is good.
You all seem to like colorful 3-D graphs so here is the so called "waterfall:"
I don't trust this graph much. For one thing, these graphs can be manipulated to show any and all things. More importantly though, the Klippel NFS system I use is great for measuring frequency response but on tests like this, its structure can resonate with the speaker, which would show up as its own slices above. Maybe after I test more speakers I get confidence on reliability of this (rather useless) measurement.
Finally, step function seems to be a popular item so here it is, zoomed properly now to show the step response of each driver:
The tweeter is always "faster" so it generates a response first. It is swinging negative which means it is out of phase with the woofer which takes its time to generate its response to the right of it at opposite phase. There is discontinuity between the two (around 2.8 milliseconds).
Advanced Speaker Measurements
Here is the rest of the bits for those interested:
Full spin data is enclosed.
Correlation With Other Measurements
Stereophile measured a much more recent version and reported this for frequency response:
Focus on the black line only. It looks a heck of a lot better than our graph. Almost flat and smooth on Axis! Well, that is not what is really going on.
First the easy part, it has the same bass hump as we do (although their measurements usually exaggerates this due to their close-in measurement technique):
We show a dip post our peak in low frequency but they don't. The reason is that they are using gated measurements to eliminate echos and that hugely reduces resolution in a few hundred hertz (to one or two data points). Past that, they do have the dip but they show such a low resolution compressed graph that it is not nearly as visible. We both show the couple of peaks close to 10 kHz.
Overall, given the radically different measurement setups, I say the correlation is very good. Our data is much higher resolution than theirs.
Listening Tests
No time or setup yet for listening tests. Will do some and report back later.
Conclusions
It is interesting to measure these "classic" speakers to finally put some hard data behind their objective performance. As expected the halo is more positive than the objective data indicates. The cost of these speakers is way up there. I appreciate being built in England and needing to have good supply of bear for works after hours but it is a lot of money for this kind of measured performance.
------------
As always, questions, comments, recommendations, etc. are welcome.
Had some great sushi at my favorite spot when I went to pick this and other speakers. It was over US $60 for lunch! While I feel satisfied, I also feel poor. So please help lift my spirits by donating using: https://www.audiosciencereview.com/forum/index.php?threads/how-to-support-audio-science-review.8150/
Attachments
Last edited: