And this one …
-
Welcome to ASR. There are many reviews of audio hardware and expert members to help answer your questions. Click here to have your audio equipment measured for free!
- Forums
- Audio, Audio, Audio!
- DACs, Streamers, Servers, Players, Audio Interface
- Digital To Analog (DAC) Reviews and Discussion
You are using an out of date browser. It may not display this or other websites correctly.
You should upgrade or use an alternative browser.
You should upgrade or use an alternative browser.
Given that music is a temporal phenomena wouldn't response time tests be useful - something akin to grey-to-grey tests in monitors?
- Thread starter SyncopatedSoul
- Start date
antcollinet
Grand Contributor
Here is another visualistion of the "speed" of "static" test signals compared with music:A 20kHz full scale sine is already more dynamic than all music: It goes from max positive to max negative and back again 20,000 times a second. Real music doesn't do this since the levels of high frequencies in music are much lower than a full scale test tone.
But on top of that - here is the time domain wave form of the multi-tone test signal. Also much more dynamic than real music due to the levels of high frequencies being the same as low frequencies. Yet the typical well performing DAC can reproduce it perfectly with inaudible levels of noise and distortion - as shown in the measured test result.
View attachment 407719
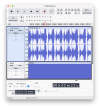
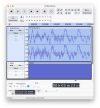
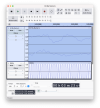
The following 3 screenshots are from Audacity. I've taken the song "My Name Is" by Eminem - not a gentle/soft track.
I've upsampled it from 44.1kHz to 385KHz This allows the "lollipop/sample" representation given by Audacity when you zoom in to show a close approximation of the 22.05kHz band limited waveform.
I've added a 3rd track, and generated a 20Khz full scale signal in it. So the first two tracks are the left/right tracks of the song, and the third is a 20kHz sine wave.
Look at the following screenshots.:
MyNameIs_1 - shows about 10s of the song from 3:21 to 3:31. If you look at the time scale - A blue vertical bar just at the .0 of 3:23.0, Ive selected s short section of the song. This is about 0.1 second long. Ive deliberately chosen the most "dynamic" section of music I could find - going +/- full scale at high frequency.
(EDIT - I've just added a red oval line around the blue bar indicating the selection)
MyNameIs_2 - is zoomed into that 0.1second. You can see that even at this zoom level, though you can see much of the song waveform, the 20Khz is still just a brick wall of blue.
MyNameIs3 - In order to zoom in far enough to see the individual cycles of 20Khz I have to zoom in to a section of the song less than 2ms long (less than 2 1/1000ths of a second)
See how when we zoom into this level how slow even the dynamic sections of music are compared to a 20Khz sine-wave.
MyNameIs1.....MyNameIs2.....MyNameIs3


Last edited:
Electronic output stage measurements should not be confused with acoustic measurements of electrodynamic multi-way transducers incorporating complex crossovers.
My understanding is that for electrical output, older designs might have phase shift at lower frequencies (the ON graph).
And in my mind, this is a delay of the right amount of time for the given wavelength of the frequency to get to the measured degree of phase shift.
The speakers are just an easier way to see the difference between FR alone and having FR and phase information.
Along those same lines, amplifiers have some characteristics which can be measured easily, but is not part of FR?
https://audiosciencereview.com/foru...-amps-behave-when-they-clip.10454/post-289211
Please see this post....
So after reading a few DAC reviews and watching a video about what all the measurements mean I was very surprised that all of them are static! Yet music is a rapidly changing phenomena. So I feel a very key important piece of the puzzle is missing in terms of understanding the performance of the measured devices.
...

Class A vs AB vs D amplifiers
You won't hear the defects even if you listen for them if you don't know the type of artifacts to listen for. I did a lossy mp3 vs lossless ABX with a colleague en he got all of them right. He told me he just listens for artifacts and not the actual music. I do the same. It took several years...
 www.audiosciencereview.com
DVDdoug
Major Contributor
- Joined
- May 27, 2021
- Messages
- 4,484
- Likes
- 6,184
With lossy compression there can be temporal artifacts that don't show-up in traditional measurements. There is an artifact called pre-echo which is sometimes heard on MP3 recordings.
People often look at the spectrum of an MP3 to show it's inferior, but the loss of high frequencies that you see usually isn't what's heard, if anything "different" is heard.
People often look at the spectrum of an MP3 to show it's inferior, but the loss of high frequencies that you see usually isn't what's heard, if anything "different" is heard.
Thanks for any input in advance.
A few years ago (2019) I measured my electricals for frequency response and phase.
Probably hooked up something like this:
PC -> USB -> Focusrite Clarett 4Pre USB -> switch -> DEQ2496 -> miniDSP OpenDRC-DI -> Benchmark DAC2 HGC -> Krell KTC preamp -> Krell FPB 350 mcx -> some alligator clip jumper wires on the amplifier terminals -> long XLR mic cable -> Focusrite Clarett 4Pre USB -> USB -> REW on PC with about 5W signal to the speaker.
All that stuff in the way should confound things!
Measurements:
.1dB droop on both ends of frequency
About 7 degrees phase at 20Hz
Impulse
Step.
Crosses zero at about 100ms as expected with 10Hz sweep start.
Result:
Pretty much "textbook" response.
Nothing to see here.
Yes amplitude is only half the story, phase is the other half. You need both to get the impulse/step response.Don’t we need phase too? I ask because I think of step response and impulse response as that start and stop question and “pretty flat FR” speakers can look different.
View attachment 407740
View attachment 407741
View attachment 407742
View attachment 407744
There was a post here somewhere where someone (I know, not much help) posted in room mic recorded measurements of speaker impulses and compared them to the mathematical derivation from a freq. sweep he also mic recorded and they were almost identical.
The multiple drivers in a speaker have there own measurement issues. Freq. sweeps don't show any inter driver IMD, how one driver effects another. If the woofer and mid are in the same volume the woofer back pressure into the cab can effect the mid driver. The speaker being a mechanical system can also cause problems. Two tones into one driver can cause doppler distortion, also not shown by a sweep.
For these reasons I would like to see speaker multitone distortion measurements, music is multitone so should be one of our measurements.
I think
There was a post here somewhere where someone (I know, not much help) posted in room mic recorded measurements of speaker impulses and compared them to the mathematical derivation from a freq. sweep he also mic recorded and they were almost identical.
That was me.
I couldn't "believe" the calculations taken from a frequency sweep sine tone could recreate the "edges" of an impulse (single full scale sample) or step (in this case, a 10hz square wave).
So I sent these sounds through the speakers, and recorded them with Audacity, and compared them to the calculations taken from the REW swept sine test tone.
Impulse

Impulse Response
Presented for your amusement: Single Full Scale Bit sent through speakers, playback recorded in Audacity: Impulse response calculated from a ten second 10-24kHz sweep tone (three weeks ago) in REW: Well, I am amused.
 www.audiosciencereview.com
Step

Impulse Response
Presented for your amusement: Single Full Scale Bit sent through speakers, playback recorded in Audacity: Impulse response calculated from a ten second 10-24kHz sweep tone (three weeks ago) in REW: Well, I am amused.
 www.audiosciencereview.com
kemmler3D
Master Contributor
Obviously this is centuries late in internet terms, but it would be really cool to see a comparison of the generated and recorded impulse using Deltawave. I have always wondered about this because the generated / calculated impulse will be missing any nonlinear effects like harmonic distortion, where the recorded one will show artifacts from them... I think.That was me.
I couldn't "believe" the calculations taken from a frequency sweep sine tone could recreate the "edges" of an impulse (single full scale sample) or step (in this case, a 10hz square wave).
So I sent these sounds through the speakers, and recorded them with Audacity, and compared them to the calculations taken from the REW swept sine test tone.
Impulse

Impulse Response
Presented for your amusement: Single Full Scale Bit sent through speakers, playback recorded in Audacity: Impulse response calculated from a ten second 10-24kHz sweep tone (three weeks ago) in REW: Well, I am amused.www.audiosciencereview.com
Step

Impulse Response
Presented for your amusement: Single Full Scale Bit sent through speakers, playback recorded in Audacity: Impulse response calculated from a ten second 10-24kHz sweep tone (three weeks ago) in REW: Well, I am amused.www.audiosciencereview.com
oleg87
Addicted to Fun and Learning
An audiophile chasing the sound of FM radio is a new one...Years ago, I stumbled upon an FM broadcast of musicians performing live in the studio. It sounded fantastic! I immediately started scratching my head trying to figure out why it sounded so much better than recorded music. I figured that the difference was timing. Since then, I've experienced nice improvements in vinyl playback by upgrading the power supply to the turntable motor. These upgrades resulted in more accurate and precise spinning of the disc.
Obviously this is centuries late in internet terms, but it would be really cool to see a comparison of the generated and recorded impulse using Deltawave. I have always wondered about this because the generated / calculated impulse will be missing any nonlinear effects like harmonic distortion, where the recorded one will show artifacts from them... I think.
Does Deltawave accept/create a sweep as input to create an impulse and step response?
@pkane
kemmler3D
Master Contributor
I think you can export the generated IR from REW as a .WAV file, which could go into DW? Maybe I imagined that. You could use Voxengo Deconvolver to generate the IR if not.
DeltaWave can compute the impulse response from any music track, not just from a sweep. As long as you can compute the difference between the original source file and the output of a device, you can plot IR:
DeltaWave can compute the impulse response from any music track, not just from a sweep.
boxerfan88
Major Contributor
- Joined
- Oct 23, 2018
- Messages
- 1,154
- Likes
- 1,363
Let's take the multitone test as an example to illustrate what I mean. Given 2 devices that have the same exact multitone chart, isn't it possible for one of them to stabilize from silence to signal faster than the other? Couldn't one have cleaner transition from silence to signal than the other? Couldn't these things be audible and impact the listening experience? (be it in responsiveness or other ways)
What I would have liked to see is a test similar to the grey-to-grey test they do in monitors. That is I would like to see how fast the DAC stabilizes on that multitone signal from silence, and then how long does it take for it to stabilize back on silence once the signal is off. This would be sort of a equivalent to a black to white and then white to black test. Then another test could simulate transitioning between to different multitone configurations similar to a grey-to-grey test in monitors. That way we could have a measure for the response times of different devices. Other tests could test the cleanness of the transitions - did they overshoot? wiggle?
That’s an interesting idea indeed. It’s like the frequency response waterfall chart showing the nature of decay. Driven by a multi tone signal instead of a sweep signal.
I don’t think I have seen anything like this done before…
kemmler3D
Master Contributor
Well, again, this would tend to show up in the frequency / phase response charts...That’s an interesting idea indeed. It’s like the frequency response waterfall chart showing the nature of decay. Driven by a multi tone signal instead of a sweep signal.
I don’t think I have seen anything like this done before…
Similar threads
- Replies
- 19
- Views
- 2K
- Replies
- 36
- Views
- 3K
- Replies
- 3
- Views
- 701
- Poll
- Replies
- 25
- Views
- 6K
