• WANTED: Happy members who like to discuss audio and other topics related to our interest. Desire to learn and share knowledge of science required. There are many reviews of audio hardware and expert members to help answer your questions. Click here to have your audio equipment measured for free!

At what frequency does sidemounted bassdrivers become a trouble for sound location ?

At what frequency does sidemounted bass drivers become a trouble for sound location ?

  • 1. 500 Hz

    Votes: 2 5.6%
  • 2. 400 Hz

    Votes: 3 8.3%
  • 3. 300 Hz

    Votes: 5 13.9%
  • 4. 200 Hz

    Votes: 6 16.7%
  • 5. 150 Hz

    Votes: 13 36.1%
  • 6. 100 Hz

    Votes: 2 5.6%
  • 7. 80 Hz

    Votes: 5 13.9%

  • Total voters
    36

ctrl

Major Contributor
Forum Donor
Joined
Jan 24, 2020
Messages
1,640
Likes
6,281
Location
.de, DE, DEU
I suggest you should read user manual or look context menu.
Sorry, I had worded it in a misleading way:
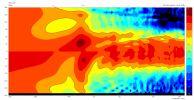
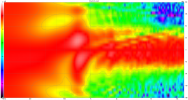
Wish that VCAD would support stepped colors and the default step size of 3dB in the sonograms...

What I meant was that it would be helpful for me if stepped colors with a step size of 3dB were supported (instead of a gradient), because then comparisons, also with other sources, would be easier for me - but it's not a big deal, VCAD is excellent!
1677421593155.png 1677421911576.png
 

kimmosto

Active Member
Joined
Sep 12, 2019
Messages
220
Likes
526
if stepped colors with a step size of 3dB were supported (instead of a gradient)
Polarmap is based on data interpolated between two nearest measured angles so it's almost never fact in VCAD with polar reponse data measured with large angle step such as 10 degrees. It's kinda overrated graph which does not earn so much attention as different options such as stepped colors or contour lines or plain gradient and adjustable step etc. The most significant problem with stepping color is that it does not support small step and large dB span at the same time with normal color circle/rainbow palette. dB span should be narrow or step should be high enough to distinguish edges of the steps. 3 dB step works with 30 dB span, but 1 dB step does not. Contour lines work also with 1 dB step so it's more versatile visualisation and selected to VituixCAD. Few levels such as 3 dB could be emphasized of course, but that applies to normalized view - which is also just a lie.
Directivity waterfall, 2D area, 2D line and surface charts show more fact in VCAD because data can be raw measured responses exactly to measured directions without interpolatation.
 

dannut

Member
Joined
Dec 31, 2020
Messages
75
Likes
75
Polarmap is based on data interpolated between two nearest measured angles
Could some measurement programs implement a better scheme? (@JohnPM?) Radiation-mode method is more precise than interpolation and could easily achieve 1deg resolution without n+1 different measurements.
 

kimmosto

Active Member
Joined
Sep 12, 2019
Messages
220
Likes
526
Could some measurement programs implement a better scheme?
Maybe one day, but polarmap is not in top-10 design paremeters and quality measures so why it should be perfect and require some special math other than linear or spline interpolation? It is mostly just entertainment, but of course it has became bigger than life on ASR where self- or community-composed quality metrics are quite popular.
 

dannut

Member
Joined
Dec 31, 2020
Messages
75
Likes
75
Like your pragmatic style. Ofcourse it is OT in this topic and I don't think data acquisition belongs on your software suite.

My line of reasoning would be not to get 'better' angular resolution, but to get better allocation of resources. To get 10deg resolution in one plane, you have to take 36 measurements on that plane alone (in practice 18 with symmetrical stuff). Same angular resolution can be achieved with just a couple of measurements. The beauty of this method is, unlike interpolation, all the data are 'true' representation of the DUT. Resolution depends only on how high order modes you are trying to incorporate in the data.
 

kimmosto

Active Member
Joined
Sep 12, 2019
Messages
220
Likes
526
Same angular resolution can be achieved with just a couple of measurements.
That is based on some assumptions about DUT. Not necessarily fact in every case. I capture off-axis with CLIO QC and Outline ET. Typical step is 5 deg, 0-180 deg or 0-360 deg depending on case. No problem to let system run for few minutes and have some coffee :cool:
VituixCAD draws linear contours to polarmap with ideal responses system so that is also close to fact when system is at "the target".
 
Top Bottom