• WANTED: Happy members who like to discuss audio and other topics related to our interest. Desire to learn and share knowledge of science required. There are many reviews of audio hardware and expert members to help answer your questions. Click here to have your audio equipment measured for free!

An Attempt To Understand Spectral Content From An ETC Response. An Article from Nyan Mellor.

Trdat

Addicted to Fun and Learning
Forum Donor
Joined
Sep 6, 2019
Messages
968
Likes
397
Location
Yerevan "Sydney Born"
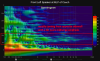
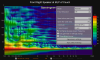
I have attached an article by Nyan Mellor, who has some great content on his website that follows much of the principles that I have learnt from ASR and Floyd Toole's work. Nyan also has an interesting white paper that summarizes what a average good room response should look like. The importants of "off axis" response and its similar spectral content that reflects to the listener. The article that I have linked mentions that an ETC graph is not enough to understand the spectral characteristics of the reflection just that an ETC shows us the reflections and its arrival times.

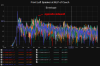
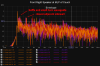
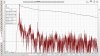
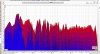
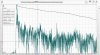
But then, he shows us 2 ETC responses one that is problematic(ragged edges) and another that is okay and describes how the energy return from the wall is spectrally consistent. Unfortunately, no explanation what we are looking for or not clear enough for the laymen.

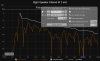
Then in the problematic response he mentions that the plots shown are indicative of poor off axis response but I don't seem to understand the plots mentioned or what we are looking that describes poor off axis response. (Filtering ETC in one octave bands. How do we do that and what are we looking for?

1. Can we understand spectral content from an ETC or not? or are we just seeing some consistency that points us in the right direction of how reflections should look like?
2. If so, what am I looking at?
3. Any discussion on this topic would be fascinating and a great learning curve for many.

https://www.hifizine.com/2011/12/listening-room-reflections-and-the-energy-time-curve/
 

ernestcarl

Major Contributor
Joined
Sep 4, 2019
Messages
3,113
Likes
2,330
Location
Canada
Looking at an unfiltered ETC, it's no easy task figuring out which peaks correspond to what frequencies. Filtering will help isolate these problem frequencies -- 1/1 or 1/3 octave filtering can be applied and cycled through one by one -- just click on the options button in the Filtered IR tab view. I forgot how one could determine which boundary the peaks correspond with... I know I bookmarked an article or website discussing this but can't recall now.

Also, I'm not an acoustician so cannot really give a strongly informed opinion on what the standard/best domestic listening small room ETC graph patterns should look like.

But from what I understand, ideally the envelope and prominent peaks should all gradually decline smoothly over time. At the main listening positions of my own listening room (multichannel system where stereo is almost always upmixed and where I can always vary the SPL level of the surrounds), most of the very early reflections are already below -10 dB or close to -15 dB. Everything after 20 ms is at -20 dB or lower which also has been the general recommendation I found from a couple of places. Stereo only systems would likely benefit more from the contribution of spectrally consistent reflections, otherwise the room may sound too 'dead' or dry.

Additionally, it may help to supplement the ETC with other views such as the wavelet spectrogram (I try to view this with and without normalization and sometimes limit bandwidth during measurement -- alternatively, one could convolve the IR with a linear HP/brickwall filter in post just to make things easier to "read", for example, by limiting the focus in the HF). This involves a lot more steps so you could just skip that idea altogether.

*From the attached images: my right speaker is closer to the immediate adj. sidewall hence the slightly stronger very early reflection spike around 2.6 ms. And because of the speakers' horn waveguide, off-axis angling to minimize effect from walls, and room treatment I think the direct sound overpowers much of the leftover spectral coloration imbalance that might have otherwise influenced the perceived tonality strongly.
 

Attachments

  • ETC LEFT.png
    ETC LEFT.png
    187 KB · Views: 119
  • ETC RIGHT.png
    ETC RIGHT.png
    179 KB · Views: 122
  • ETC filtered.png
    ETC filtered.png
    68.2 KB · Views: 116
  • ETC 4.png
    ETC 4.png
    381 KB · Views: 105
  • ETC 5.png
    ETC 5.png
    523.3 KB · Views: 106
Last edited:

Kvalsvoll

Addicted to Fun and Learning
Audio Company
Joined
Apr 25, 2019
Messages
888
Likes
1,657
Location
Norway
This article is 10 years old, we now have a slightly different approach on how to analyze room+speaker combinations.

ETC/IR shows reflections weighted toward higher frequencies, and it does not show anything about spectral behavior. It is not so useful to use this as a reference for optimizations of room acoustics, it is more like nice to look at to see how it is. Use decay analysis to see what is going on in the room instead (Decay, RT60 Decay, spectrum), this will reveal tonal balance of the reflective energy in the room, which can then be used as guidance for changing room acoustic treatment.

And the reflection level is way too high in those ETC plots shown, a good room should look more like this:
rom2 etc.png


As always, one must take care when analyzing any measurement, here the peak at 1.8ms is from the mic mount and chair, this distorts the view of the initial gap, which is quite good in this room, drops fast to around -35dB and rises towards 10ms, then the room looks very dead because the energy falls off, but if we look at decay/RT60 Decay/spectrum, we see that this is not the case, being a quite small room, the decay time will be short.

So, how does the perfect ETC look like? Initial drop should be fast and down to very low level, then rise later, before gently falling off, and there should be no peaks like the one around 12ms in this plot. BUT - in a small room, it will be difficult and impractical to get rid of all reflections, and having some reflections does not necessarily compromise sound quality. Use ETC as a nice graph to look at, accept that this is how this room+speaker combinations is, it is not so useful as a tool to actually do improvements to the room.
 

ernestcarl

Major Contributor
Joined
Sep 4, 2019
Messages
3,113
Likes
2,330
Location
Canada
The room measured in your plot is very well treated I presume. Most of the ETCs I've seen from others posted in this forum are almost always quite elevated/higher. Same with the decay and RT... my room is also small enough that there really isn't much of a reverb to speak of, and the decay is pretty short as well.

I recall an acoustician who said that he doesn't even bother to look at RT60s in small rooms anymore. Hmmmn... But I find the variances striking. Many of the differences we hear of the same speaker between very different rooms are probably at least half from the room acoustics of the space.

Use ETC as a nice graph to look at, accept that this is how this room+speaker combinations is, it is not so useful as a tool to actually do improvements to the room.

So you would say skip it altogether then, and just jump to the decay plot view instead?

Personally, I kind of think it might be still useful to examine if you want to visualize within a graph format as to what is going on with some of the reflections in there. *Although caution must be made with the reading, of course, as in the case with your microphone being in the way, and maybe over-interpreting reflections as automatically harmful to the "sound quality".
 
Last edited:

ernestcarl

Major Contributor
Joined
Sep 4, 2019
Messages
3,113
Likes
2,330
Location
Canada
Come to think of it, some of those very early spikes that I attributed to the speaker baffle or small horn may have been from my couch and/or mic :oops:

Use decay analysis to see what is going on in the room instead (Decay, RT60 Decay, spectrum), this will reveal tonal balance of the reflective energy in the room, which can then be used as guidance for changing room acoustic treatment.

Oh yeah, I guess you already answered my question.
 

Kvalsvoll

Addicted to Fun and Learning
Audio Company
Joined
Apr 25, 2019
Messages
888
Likes
1,657
Location
Norway
The room measured in your plot is very well treated I presume. Most of the ETCs I've seen from others posted in this forum are almost always quite elevated/higher.

This room is quite good, with well controlled decay from around 80-100Hz and up, and it does not sound too dry. If you look at the ETC i posted, you see there are some spikes showing up, they are caused by reflective surfaces mainly at the back of the room, some of those reflections just happen to reflect directly back to where the mic is located, and they do not cause a total destruction of the sound. Yes - they can be removed, and then end up with a problem with too much absorption at higher frequencies. They are supposed to be there.

I see mainly 2 mistakes people do when treating a room - too much absorption at higher frequencies, and overall too long/too much decay.
 
OP
Trdat

Trdat

Addicted to Fun and Learning
Forum Donor
Joined
Sep 6, 2019
Messages
968
Likes
397
Location
Yerevan "Sydney Born"
Looking at an unfiltered ETC, it's no easy task figuring out which peaks correspond to what frequencies. Filtering will help isolate these problem frequencies -- 1/1 or 1/3 octave filtering can be applied and cycled through one by one -- just click on the options button in the Filtered IR tab view. I forgot how one could determine which boundary the peaks correspond with... I know I bookmarked an article or website discussing this but can't recall now.

Yeh there is a way in REW that gives you a length that corresponds to the peak which you can measure physically to the wall but that doesn't tell me about the poor off axis return.

Appreciate your ETC pictures Ill try and understand them as much as I can.
 
OP
Trdat

Trdat

Addicted to Fun and Learning
Forum Donor
Joined
Sep 6, 2019
Messages
968
Likes
397
Location
Yerevan "Sydney Born"
ETC/IR shows reflections weighted toward higher frequencies, and it does not show anything about spectral behavior.

The article made it look like there was a way to understand spectral behaviour but it seems there isnt.
It is not so useful to use this as a reference for optimizations of room acoustics, it is more like nice to look at to see how it is.

Okay I think this is key, we can just use it to get an idea.

Use decay analysis to see what is going on in the room instead (Decay, RT60 Decay, spectrum), this will reveal tonal balance of the reflective energy in the room, which can then be used as guidance for changing room acoustic treatment.

Can you direct me on how we figure out the tonal balance from Decay, RT60 and spectrum graphs.

drops fast to around -35dB and rises towards 10ms, then the room looks very dead because the energy falls off. Initial drop should be fast and down to very low level, then rise later, before gently falling off, and there should be no peaks like the one around 12ms in this plot. BUT - in a small room, it will be difficult and impractical to get rid of all reflections, and having some reflections does not necessarily compromise sound quality. Use ETC as a nice graph to look at, accept that this is how this room+speaker combinations is, it is not so useful as a tool to actually do improvements to the room.

Yes this is new to me, his summary mentions a gradual decline over the 40ms not a sudden drop in the first 10ms. Greisenger also notes after a certain ms all reflections create envelopement.

So is there a way to understand if the speaker has poor off axis response from the ETC in which the way the article made it sound like there is?
 
OP
Trdat

Trdat

Addicted to Fun and Learning
Forum Donor
Joined
Sep 6, 2019
Messages
968
Likes
397
Location
Yerevan "Sydney Born"
Here is my ETC graph for good measure.

1631077839520.jpeg
 

ernestcarl

Major Contributor
Joined
Sep 4, 2019
Messages
3,113
Likes
2,330
Location
Canada
Here is my ETC graph for good measure.

View attachment 152031

Do you know what's causing that second stronger peak at around 1.7ms?

Hmmmn... Maybe you swept L+R instead of just one single channel, perhaps?

Nothing else really strikes out to me so perhaps a decay plot might be more revealing here.

I believe @Kvalsvoll frequently uses the ff. settings:
1631093658714.png


---

Yeah, looking at any kind of plot in isolation and without much more context is always going to be a very difficult (if not futile) exercise. In fact I probably should have provided more context to my own ETC graphs. I did post some pics recently here: Fullrange speaker project based on Morel TSCM 634

Multiple measurements were all from the center MLP of the couch, BTW, and not of the sit-stand desk setup right in front. Main speakers pointing into the corners instead of directly to the MLP to also reduce sidewall bounce.

Additionally, the early reflection, decay, FR, and spectrum at the corner seats of my couch (very close to the immediate sidewalls) may be a little interesting to examine with a bit more detail on the side for later...
 
Last edited:

ernestcarl

Major Contributor
Joined
Sep 4, 2019
Messages
3,113
Likes
2,330
Location
Canada
I see mainly 2 mistakes people do when treating a room - too much absorption at higher frequencies, and overall too long/too much decay.

I am guilty of the first one, but I have been slowly removing a few panels here and there to gradually bring back more reflections back in.
 
OP
Trdat

Trdat

Addicted to Fun and Learning
Forum Donor
Joined
Sep 6, 2019
Messages
968
Likes
397
Location
Yerevan "Sydney Born"
Do you know what's causing that second stronger peak at around 1.7ms?

Have no idea but according to Kvalsvall it could be from the mic stand although I am going to hazard a guess it could be from my table in front and below the mic.
Hmmmn... Maybe you swept L+R instead of just one single channel, perhaps?

Output was left/right yes. Should I do one channel seperately. But reference output was left, is there any difference between these two in preferences?

Nothing else really strikes out to me so perhaps a decay plot might be more revealing here.

RT60 Decay or Decay? Ill post it up, perhaps some general points will help.

I believe @Kvalsvoll frequently uses the ff. settings:

Where do I find these ff settings?

Yeah, looking at any kind of plot in isolation and without much more context is always going to be a very difficult (if not futile) exercise. In fact I probably should have provided more context to my own ETC graphs. I did post some pics recently here: Fullrange speaker project based on Morel TSCM 634
https://www.audiosciencereview.com/...ect-based-on-morel-tscm-634.26317/post-902110

Great, I am onto it. You also had another plot in another recent thread. Ill take a look at all of them.
 

Frgirard

Major Contributor
Joined
Apr 2, 2021
Messages
1,737
Likes
1,043
Is it a treasure hunt?

Your measures is bad. The second pic is higher the t=0!

So to help the community of the hunter, picture of your setup, distance... Clues for find the treasure.
 

Thomas_A

Major Contributor
Forum Donor
Joined
Jun 20, 2019
Messages
3,469
Likes
2,466
Location
Sweden
I think ETC can be viewed as where you have the reflections in time. I attach my results at 50 cm, 160 cm and LP. However the sound level was probably a bit too low at LP to show proper decay. Some early reflection peaks are there however.
 

Attachments

  • LP.png
    LP.png
    323.7 KB · Views: 77
  • 160 cm.png
    160 cm.png
    365.5 KB · Views: 88
  • 50 cm.png
    50 cm.png
    301.3 KB · Views: 86
OP
Trdat

Trdat

Addicted to Fun and Learning
Forum Donor
Joined
Sep 6, 2019
Messages
968
Likes
397
Location
Yerevan "Sydney Born"
So I measured R/L seperately and have added the decay plot.
 

Attachments

  • Right ETC (2).jpg
    Right ETC (2).jpg
    483.1 KB · Views: 91
  • Right Decay (2).jpg
    Right Decay (2).jpg
    345.2 KB · Views: 88
  • Left ETC (2).jpg
    Left ETC (2).jpg
    463.3 KB · Views: 87
  • Left decay (2).jpg
    Left decay (2).jpg
    353.7 KB · Views: 80

Thomas_A

Major Contributor
Forum Donor
Joined
Jun 20, 2019
Messages
3,469
Likes
2,466
Location
Sweden
Shouldn't the first 1-2 ms be "very clean" to have a good stereo image?
 

Kvalsvoll

Addicted to Fun and Learning
Audio Company
Joined
Apr 25, 2019
Messages
888
Likes
1,657
Location
Norway
The article made it look like there was a way to understand spectral behaviour but it seems there isnt.

Yes, we use filtered ETC/IR - but what we then see makes no sense. When the bandwidth is limited, the graph expands in time (no surprise to those into mathematics), it looks like it will always be worse the lower you go in frequency, no matter how much we absorb and dampen everything, it looks horrible, and we conclude there is no way to fix it. But this is not real - looking at decay graphs, we see that it is indeed possible to achieve a consistent decay profile across the whole frequency range - same decay at 200Hz compared to 2KHz.
 

ernestcarl

Major Contributor
Joined
Sep 4, 2019
Messages
3,113
Likes
2,330
Location
Canada
So I measured R/L seperately and have added the decay plot.

The decay plot is now much more revealing (compared to just the raw ETC) as we’re viewing in high resolution both frequency magnitude and time. That said, we do not really hear at such a high resolution as your graph settings seem to be set at for (by default?). Maybe some smoothing — 1/12 octave, at least to make things easier to read.
 

Frgirard

Major Contributor
Joined
Apr 2, 2021
Messages
1,737
Likes
1,043
1/12 octave, at least to make things easier to read.
Toole, E Winer had shown we heard up 1/24 for the FR. For other curves (waterfall, decay, spectrogram, group delay) what would be the optimal resolution ?
 
Top Bottom