• WANTED: Happy members who like to discuss audio and other topics related to our interest. Desire to learn and share knowledge of science required. There are many reviews of audio hardware and expert members to help answer your questions. Click here to have your audio equipment measured for free!

An Attempt To Understand Spectral Content From An ETC Response. An Article from Nyan Mellor.

OP
Trdat

Trdat

Addicted to Fun and Learning
Forum Donor
Joined
Sep 6, 2019
Messages
968
Likes
397
Location
Yerevan "Sydney Born"
Yes, if we normalize later sound to the first arrival, we see how the speaker-room changes the spectral distribution of the reflected energy.

If the speaker has smooth and reasonably flat off-axis response, and the room is not overly strange, the later decay lines will be more equal to the first. As we move further out in time, the lines will tend to look like the power response of the speaker.

Let us say we have a speaker with wider radiation around 5KHz, and collapsing highs above 8KHz. Then we will see that the later decay lines will have a boost around 5K, and then drop off above 8K.

If we mis-treated the room with too much high frequency absorption, we will see that the higher frequencies drops off in the later decay lines.

This will hold until we get down to quite low frequencies. In the bass-range, the room will be dominant, regardless of speaker radiation pattern.

Really appreaciate this, I never thought I will one day understand the basics with decay graphs. I can imagine there is a lot that comes with experience such as knowing what a good sounding room really looks like, but for now I am delighted to get this down pat but just to confirm, when you say a boost around 5k do you mean an elevation in the SPL(repsonse curve)? As in the the first line elevated or all the decay lines elevated? Or the decay lines closer to each other?(I think decay lines closer to each other means room modes)

And when you say "normalize later sound to the first arrival" are you figuratively speaking or its something I have to do with REW to "normalize" it? Maybe you just mean comparing them yes?

And yes, I just saw my room has the decay lines drop off from around 12k and is fairly absorbed but I can now compare this to the RT60 graph and get a better undestanding, like you said each graph complements each other and in isolation don't say too much. And I am guessing its no coincidence that my horn speakers have the subsequent decay lines more similar to the first compared to my wide dispersion speakers.

Lastly, what does it mean if the high frequencies say around 7k to 12k are bunched up with decay lines closer together? I thought this was a low frequency phenomenan? They get closer together towards the 7k with the subsequent later time intervals such as 140ms.
 

dasdoing

Major Contributor
Joined
May 20, 2020
Messages
4,301
Likes
2,769
Location
Salvador-Bahia-Brasil
Have no idea but according to Kvalsvall it could be from the mic stand although I am going to hazard a guess it could be from my table in front and below the mic.

REW has a tool to measure how much longer the reflected sound traveled. or you can just calculate it: 1.7ms = 0.58m
what you than can do to easily find the surface is to atach a string close to the tweeter (or where you earheight is), than take the other end to the LP, add 0.58m to the lenght you got. one person hold the resulting lenght at LP, the other checks possible surface until the string is under tension again.
BTW: this is why ETC is usefull for treating
 

Kvalsvoll

Addicted to Fun and Learning
Audio Company
Joined
Apr 25, 2019
Messages
888
Likes
1,657
Location
Norway
when you say a boost around 5k do you mean an elevation in the SPL(repsonse curve)? As in the the first line elevated or all the decay lines elevated? Or the decay lines closer to each other?(I think decay lines closer to each other means room modes)
Think of each decay-line as a frequency response - a response that shows the tonality of the sound in the room, a specific time after the speaker was silent.

The 5K was meant to be like an example, when I write boost I mean increased level.
 

Kvalsvoll

Addicted to Fun and Learning
Audio Company
Joined
Apr 25, 2019
Messages
888
Likes
1,657
Location
Norway
I can imagine there is a lot that comes with experience such as knowing what a good sounding room really looks like
Believe me, it is easier to tell how a room sound from a picture, than trying to analyze measurements. Well, we can say something from measurements, but it is not always so easy to tell and correlate what the graphs show into how the sound is actually experienced.
 

markus

Addicted to Fun and Learning
Joined
Sep 8, 2019
Messages
702
Likes
809
The rise time is the window - a long window drags along everything that happened before, so that the second 20ms line when using a 100ms rise-time will not show what is going on after 20ms, because it contains sound from 100ms backwards in time.

Rise time is the left hand window. "Window" defines the overall window length. Guess that's what you meant though.

What settings did you use in the two decay plots you've posted above? Often people forget to post the settings which makes the graphs virtually impossible to interpret.
 
Last edited:

Kvalsvoll

Addicted to Fun and Learning
Audio Company
Joined
Apr 25, 2019
Messages
888
Likes
1,657
Location
Norway
What settings did you use in the two decay plots you've posted above? Often people forget to post the settings which makes the graphs virtually impossible to interpret.
This is important, because the graphs really have no meaning and can not be compared to anuthing without knowing what they show:
- Slice interval 20ms, window 500ms, Rise-time 20ms. 1/12 smoothing.

I often try to include the settings in the picture, but did not do so here.
 

ernestcarl

Major Contributor
Joined
Sep 4, 2019
Messages
3,113
Likes
2,330
Location
Canada
This is important, because the graphs really have no meaning and can not be compared to anuthing without knowing what they show:
- Slice interval 20ms, window 500ms, Rise-time 20ms. 1/12 smoothing.

I often try to include the settings in the picture, but did not do so here.

Other variables:

The length of one's measurement (If I remember correctly, short sweeps appear a little more smoothed), SPL level, single or two output channel setting (L+R), PEQs and xo applied, axis, and distance also could affect the appearance of the decay graphs. For example, to reduce some noise still visible one may want to try increasing the level -- to make it even more comparable with other graphs -- one could also change the vertical scaling to be the same and/or apply an dB offset. Having access to the MDAT and knowing all conditions (e.g. size of room, type and arrangement of acoustic treatment and positioning) at the time measurements were made would be more preferable.

It's impossible/impractical to remember writing everything in detail, though.
 

markus

Addicted to Fun and Learning
Joined
Sep 8, 2019
Messages
702
Likes
809
Other variables:

The length of one's measurement (If I remember correctly, short sweeps appear a little more smoothed), SPL level, single or two output channel setting (L+R), PEQs and xo applied, axis, and distance also could affect the appearance of the decay graphs. For example, to reduce some noise still visible one may want to try increasing the level -- to make it even more comparable with other graphs -- one could also change the vertical scaling to be the same and/or apply an dB offset. Having access to the MDAT and knowing all conditions (e.g. size of room, type and arrangement of acoustic treatment and positioning) at the time measurements were made would be more preferable.

It's impossible/impractical to remember writing everything in detail, though.

The main problem with short sweeps is noise, especially at lower frequencies. The longer the sweep the better the signal to noise ratio.
This is also a reason why decay plots can be misleading. What looks like valid data is just noise.

Looking at the Schroeder integral and where the Topt regression line stop tracking each other is probably a good indicator:

noise.png
 

markus

Addicted to Fun and Learning
Joined
Sep 8, 2019
Messages
702
Likes
809
This is important, because the graphs really have no meaning and can not be compared to anuthing without knowing what they show:
- Slice interval 20ms, window 500ms, Rise-time 20ms. 1/12 smoothing.

I often try to include the settings in the picture, but did not do so here.

Thanks. Why not use a shorter rise time and shorter right side window so the data in each slice doesn't overlap?
 

dasdoing

Major Contributor
Joined
May 20, 2020
Messages
4,301
Likes
2,769
Location
Salvador-Bahia-Brasil
imo the decay graph is very hard to read.
I love the spectrogram for reading the time. the possibility to normalize to peak is also very handy; it will show the room, wihout the FR distorsion
 

markus

Addicted to Fun and Learning
Joined
Sep 8, 2019
Messages
702
Likes
809
imo the decay graph is very hard to read.
I love the spectrogram for reading the time. the possibility to normalize to peak is also very handy; it will show the room, wihout the FR distorsion

Frankly, all plots showing magnitude and time are hard to read. It's very easy to misinterpret the data which is routinely done. Marketing departments also noticed ;)
 

dasdoing

Major Contributor
Joined
May 20, 2020
Messages
4,301
Likes
2,769
Location
Salvador-Bahia-Brasil
Frankly, all plots showing magnitude and time are hard to read. It's very easy to misinterpret the data which is routinely done. Marketing departments also noticed ;)

thats why normalize to peak on spectogram in REW is so nice. it takes the magnitude out of the equation
 

markus

Addicted to Fun and Learning
Joined
Sep 8, 2019
Messages
702
Likes
809
thats why normalize to peak on spectogram in REW is so nice. it takes the magnitude out of the equation

Not really. I'm more concerned with what the plot shows in regards to time/frequency tradeoff, noise, etc.pp. What you see is not necessarily "what you get". Normalization doesn't help here. It might make it even harder to interpret... But each setting has its application. Depends on what you're interested in or what you want to show.
 

dasdoing

Major Contributor
Joined
May 20, 2020
Messages
4,301
Likes
2,769
Location
Salvador-Bahia-Brasil
Not really. I'm more concerned with what the plot shows in regards to time/frequency tradeoff, noise, etc.pp. What you see is not necessarily "what you get". Normalization doesn't help here. It might make it even harder to interpret... But each setting has its application. Depends on what you're interested in or what you want to show.

what is it you wanna see? it's perfect for the ringing of the room.
for reflections ETC is perfect; it's midrange biased but in the bass reflections and ringing can be treated as the same thing since we hardly hear it directly
 

Adhoc

Member
Joined
Jul 30, 2020
Messages
11
Likes
13
The main problem with short sweeps is noise, especially at lower frequencies. The longer the sweep the better the signal to noise ratio.
This is also a reason why decay plots can be misleading. What looks like valid data is just noise.

Looking at the Schroeder integral and where the Topt regression line stop tracking each other is probably a good indicator:

View attachment 163331

My ETCs are quite similar. What I have noticed though, is that when the Schröder Integral curve start to rise above the straight line (around -30 to -40 dB), it is because of bass mode frequencies are lingering for a longer time at the place of the microphone. If I move the microphone towards the front or rear of the room, the rise will start somewhat sooner or later in time
 

markus

Addicted to Fun and Learning
Joined
Sep 8, 2019
Messages
702
Likes
809
what is it you wanna see? it's perfect for the ringing of the room.
for reflections ETC is perfect; it's midrange biased but in the bass reflections and ringing can be treated as the same thing since we hardly hear it directly
The decay plot can be used for a general overview when comparing different rooms or it can give you a general idea about the spectrum of the indirect sound field, or... All just tools. Use whatever serves the purpose best.
 

markus

Addicted to Fun and Learning
Joined
Sep 8, 2019
Messages
702
Likes
809
My ETCs are quite similar. What I have noticed though, is that when the Schröder Integral curve start to rise above the straight line (around -30 to -40 dB), it is because of bass mode frequencies are lingering for a longer time at the place of the microphone. If I move the microphone towards the front or rear of the room, the rise will start somewhat sooner or later in time

The good old discussion about why "RT60 is meaningless in acoustically small rooms" :) Let's not go there.
 

ernestcarl

Major Contributor
Joined
Sep 4, 2019
Messages
3,113
Likes
2,330
Location
Canada
The main problem with short sweeps is noise, especially at lower frequencies. The longer the sweep the better the signal to noise ratio.
This is also a reason why decay plots can be misleading. What looks like valid data is just noise.

Looking at the Schroeder integral and where the Topt regression line stop tracking each other is probably a good indicator:

View attachment 163331

I re-checked comparing the shortest sweep (128k) and longest (4M), and it's really the higher noise floor that is the obvious difference. Turns out it's the harmonic distortion graphs that look somewhat more smoothed in the bass area with the really fast sweeps.
 

ernestcarl

Major Contributor
Joined
Sep 4, 2019
Messages
3,113
Likes
2,330
Location
Canada
I bought myself a rotating platform for my monitors so I can more easily, and consistently change the angle whenever I want.

Taking measurements in the corner seats of my couch -- which are already extremely close to the sidewalls -- I steered the monitors further off-axis to minimize the immediate side-wall bounce:

1636138300323.gif

*The total effect was overall much less than I thought. ACTUALLY, it would seem this instead increased the reflection sent to the opposite wall -- so made the sound slightly more diffuse(?) Curious... I need to investigate this further...

edit: I meant the opposite wall from the farthest monitor, of course, which is the immediate sidewall at the opposite corner seat. Since the speaker is now angled to point to that side wall (and adj. rear wall) directly, these early reflection peaks are thereby increased. I don't know for sure if this is better or worse, but the direct axial response is also more linear here so I presume the reflections would be more "neutral" than not in nature. The off-axis angling pointing the closest fronts and surrounds away from the corner seated listener actually improves the listening experience since it reduces the volume of said speakers.

-----------


Upmixing regular stereo L+R to multichannel can also alter the spectral decay characteristic (on-axis):

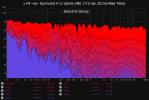
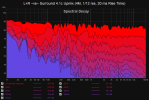
UPMIX 7.png UPMIX 8.png
Decay traces are somewhat "slowed" down -- and slightly more linear in the mids and highs.


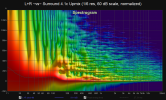
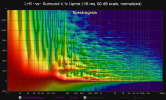
In the wavelet graphs, we can see the surround upmixed signal is automatically delayed ~20ms by JRiver's "JRSS" algorithm -- so as to not interfere with the direct sound -- hopefully, this only increases the envelopment "ambience" cues in the original stereo mix and not add too much unwanted artificial processing.

UPMIX 9.png UPMIX 10.png

There is also some additional unevenness introduced in the bass, but this is very slight.


*Forgot the ETC of same measurement

1636146591024.png


In a 7.1ch upmix, the rear surrounds are delayed by 30ms.
 
Last edited:
Top Bottom