This article is to explore how noise and distortion change through our system, and how different components can influence the final output.
<Note 1: This article assumes some knowledge of performance terms, what frequency response and harmonics are, and so forth. There are other articles, many of which are linked in my signature, that can provide the background for these terms.>
<Note 2: This article is very long. There are not any good shortcuts to understanding the problem and complexity of signal chain analyses. Trying to reduce years of education and practice into a few posts on the ‘net is challenging. I struggled for a while to decide what program(s) were appropriate – ADS, SPICE, Mathcad, Matlab, etc. – but chose Python since I need to improve my Python skills. This took several days to write as I was going through the Python/NumPy/SciPy learning curve along the way, then more days to create the examples and write the text. The advantage is that changes can be made quickly to vary different parameters, and the program can be used by anyone willing to download Python (free open-source program) and learn the language. I am NOT a Python expert.>
<Note 3: I used fairly simple models for distortion and noise. This is not for a specific design but rather a general introduction into distortion and noise changes through a signal chain. Distortion is modeled using a tanh() function appropriate for a bipolar transistor differential pair’s exponential gain characteristics. A MOSFET pair would provide square-law behavior, a “softer” curve. The tanh() function provides only odd-order harmonics so a small offset adds even-order distortion since perfect matching (and thus a perfect tanh() transfer function) is impossible in the real world. Noise is modeled as a Gaussian noise source typical of real circuits. Distortion and noise levels are adjusted independently. This is much simpler than the real world but again is just an introductory example. All voltages are peak with 1 Vpk being full-scale in the model and gains applied appropriately through the chain.>
A common question is “If I have DAC A, preamp B, and amp C, where should I set the volume and gain controls for the best performance?” Usually this results in some handwaving and a few recommendations based upon (hopefully) similar systems because we do not have all the required information for an exact answer. That information includes distortion, noise, and gain details of each block in the signal chain as well as the listener’s preferences (loudness, frequency response) and sensitivity to things like noise and distortion. Many blocks in the chain are internal and undefined to the customer, and others may have just a single set of specifications that do not completely describe the block (component). An example signal chain is shown below.

Figure 1: Example Signal Chain
This example shows a source (DAC), preamp, and power amp. The preamp and power amp may be combined in an integrated amp or receiver (or AVR). The preamp has input and output gain blocks (Ain, Aout) with a volume control (attenuator, G1) between. The power amp has an input volume (gain) control (which is not always user-controlled) and final amplifier (Amp). Each of these signal blocks has its own transfer function that includes noise and distortion. Generally all we as consumers know are the specs at the output of each component, limited to a few specific test cases. Analyzing the complete chain is a lot of guesswork, sometimes educated, other times not so much.
Common performance metrics include THD, SNR, and SINAD (THD+N). Total harmonic distortion, THD, is the ratio of the harmonic distortion to the signal itself and varies with the signal (larger signals are more distorted). By convention the sum of the first ten harmonics are used to calculate THD (so, “total” = 10). There are other types of distortion such as intermodulation distortion (IMD) that happens when two different signals are distorted to create non-harmonic terms but those are not included in this simplified model. For a discussion on THD and IMD, see this thread https://www.audiosciencereview.com/...armonic-and-intermodulation-distortion.25436/ The equations relating THD and IMD are this post: https://www.audiosciencereview.com/...odulation-distortion.25436/page-2#post-878301 Signal-to-noise ratio, SNR, does not include harmonic distortion so really is just signal to noise. Jitter sets the maximum SNR that can be achieved as -20log10(2*pi*fin*tj) where fin is the input frequency and tj the time jitter (amplitude and sampling frequency fall out of the equation). There are some caveats when measuring THD and SNR, however…
The first catch is that there will always be a little noise at the harmonic frequencies, and there is no easy way to exclude that bit of noise. (There are mathematical schemes that let instruments exclude most of the noise.) Distortion is very low when the signal level is very small, so at low levels noise tends to dominate the THD measurement. Another catch is that SNR includes non-harmonic distortion like power supply noise, clock noise, crosstalk, and so forth. Again, there is no easy way to exclude these terms, so “noise” in the SNR measurement includes everything but the fundamental signal and its harmonics. The signal-to-noise-and-distortion ratio, SINAD, includes THD and noise (THD+N) – it is the ratio of the signal to everything else. This article only considers harmonic distortion and random noise from the blocks; no other error sources are included. In the real world, the nature of the noise and distortion also affects the sound, along with those other sources not included in this simplified analysis.
I first created a model of a single block including noise and distortion as independent parameters, and a set of plots to help see the results. This also makes it easier to see how distortion and noise affect each other in the measurements. The distortion model is a tanh() function typical of a differential amplifier using bipolar transistors (this varies with device and amplifier topology; I used what I am most familiar with). The added noise is normal Gaussian noise typical of most circuits and is uncorrelated (not related to) the signal. While not strictly true, the model assumes noise is a constant and distortion increases with signal level. This is a reasonable if simplified approximation of how most real circuits operate.
First is a plot showing only distortion; there is no noise added to the signal. For this model, target THD was 100 dB at full scale input (Vin) around 1V. You can see how THD rises smoothly until the amplifier begins to clip just before 1 V. No special low-level distortion such as crossover distortion is included in the model. The SNR is set by the mathematical computational limits of the program (Python) and computer (Windows PC) and is basically a flat line at the limits of the mathematical noise floor until the signal clips. Since there is effectively no noise, SINAD is the same curve as THD (though changed in polarity since THD is usually expressed as a negative number and SNR/SINAD as positive).

The next plots show noise alone with no added distortion, and without clipping. The SNR target was 120 dB at full scale. At low signal levels, the noise is a large fraction of the signal, so SNR is low. As the signal level (volume) increases, the noise stays the same, so SNR rises. Since there is no distortion, SINAD follows the SNR curve. Notice THD is not 0%; this is because there is a little noise in each harmonic bin (the noise is “everywhere” and so a little bit ends up at each harmonic frequency) so the THD curve looks like the SNR curve (in the opposite direction since the sign is reversed). Because THD only looks at ten harmonic frequencies, and SNR looks at all the other frequencies, THD is lower (better) than SNR.

Here are the plots when both harmonic distortion and noise are included. This is more interesting and similar to what real measurements often show. At low signal levels, distortion is very low, and noise dominates the measurement so the little bit of noise in the harmonic bins (at the harmonic distortion frequencies 2…10 times the signal frequency) leads to rising THD. Note that the THD level is still lower than the total noise, since only ten frequencies are included in the THD plot so there is less energy than the total noise overall all other frequencies. At around 40 mV in this example, distortion begins to exceed noise, and the THD curve begins to reflect the actual distortion of the signal and not just noise. SNR peaks around 120 dB as intended, and THD around -100 dB, at full scale output just before the signal clips. SINAD follows the SNR curve until THD begins to exceed the noise level, at which point the SINAD curve bends down a little as distortion begins to dominate. Hard clipping sets in above full-scale output and everything “crashes”.

Finally, this first section ends with a couple of figures showing the signal behind the plots above. First is for Vin = 0.5 V, below clipping and near maximum (best) SINAD. The effective sampling rate is >1 MS/s (sampling frequency is 1.024 MHz) and bit resolution is “infinite” (limited only by the computer). A 1 kHz signal is applied. The upper plots show the entire acquisition (measurement) time, and a single cycle of the output signal (Vo). The bottom plots show the complete FFT spectrum of 512 kHz and restricted to 25 kHz to show the audio band. The noise floor is essentially constant and enough to create 120 dB SNR at full scale, and only a small bit of 2nd- and 3rd-harmonic distortion terms are visible. For this input, THD = -107.8 dB, SNR = 114.0 dB, and SINAD = 106.9 dB. When comparing values in dB, a difference of 10 dB between SNR and THD changes the SINAD by about 1 dB. If both THD and SNR are equal, the resulting SINAD will be about 3 dB worse than the individual numbers.

Below is the same set of plots for Vin = 1.26 V, past the 1 V clipping point. Notice how the top and bottom of Vo are clipped (squared off), and now a “spray” of harmonics are visible in the frequency spectrum (FFT). At this level, THD = -21.1 dB, SNR = 45.0 dB, and SINAD = 21.1 dB.

Hopefully this provides some insight into how noise and distortion will influence the output performance, and how they are related. At very low signal levels noise tends to determine the SINAD, and at high signal levels distortion (THD) dominates. There is an implicit trade that carries through the signal chain: for the highest SNR, use the highest signal level; for the lowest distortion, use the smallest signal level. Finding the optimum signal level through a cascade (chain) of blocks requires knowing the noise and distortion performance of each block as well as the listener’s desired maximum output level.
<Note 1: This article assumes some knowledge of performance terms, what frequency response and harmonics are, and so forth. There are other articles, many of which are linked in my signature, that can provide the background for these terms.>
<Note 2: This article is very long. There are not any good shortcuts to understanding the problem and complexity of signal chain analyses. Trying to reduce years of education and practice into a few posts on the ‘net is challenging. I struggled for a while to decide what program(s) were appropriate – ADS, SPICE, Mathcad, Matlab, etc. – but chose Python since I need to improve my Python skills. This took several days to write as I was going through the Python/NumPy/SciPy learning curve along the way, then more days to create the examples and write the text. The advantage is that changes can be made quickly to vary different parameters, and the program can be used by anyone willing to download Python (free open-source program) and learn the language. I am NOT a Python expert.>
<Note 3: I used fairly simple models for distortion and noise. This is not for a specific design but rather a general introduction into distortion and noise changes through a signal chain. Distortion is modeled using a tanh() function appropriate for a bipolar transistor differential pair’s exponential gain characteristics. A MOSFET pair would provide square-law behavior, a “softer” curve. The tanh() function provides only odd-order harmonics so a small offset adds even-order distortion since perfect matching (and thus a perfect tanh() transfer function) is impossible in the real world. Noise is modeled as a Gaussian noise source typical of real circuits. Distortion and noise levels are adjusted independently. This is much simpler than the real world but again is just an introductory example. All voltages are peak with 1 Vpk being full-scale in the model and gains applied appropriately through the chain.>
A common question is “If I have DAC A, preamp B, and amp C, where should I set the volume and gain controls for the best performance?” Usually this results in some handwaving and a few recommendations based upon (hopefully) similar systems because we do not have all the required information for an exact answer. That information includes distortion, noise, and gain details of each block in the signal chain as well as the listener’s preferences (loudness, frequency response) and sensitivity to things like noise and distortion. Many blocks in the chain are internal and undefined to the customer, and others may have just a single set of specifications that do not completely describe the block (component). An example signal chain is shown below.
Figure 1: Example Signal Chain
This example shows a source (DAC), preamp, and power amp. The preamp and power amp may be combined in an integrated amp or receiver (or AVR). The preamp has input and output gain blocks (Ain, Aout) with a volume control (attenuator, G1) between. The power amp has an input volume (gain) control (which is not always user-controlled) and final amplifier (Amp). Each of these signal blocks has its own transfer function that includes noise and distortion. Generally all we as consumers know are the specs at the output of each component, limited to a few specific test cases. Analyzing the complete chain is a lot of guesswork, sometimes educated, other times not so much.
Common performance metrics include THD, SNR, and SINAD (THD+N). Total harmonic distortion, THD, is the ratio of the harmonic distortion to the signal itself and varies with the signal (larger signals are more distorted). By convention the sum of the first ten harmonics are used to calculate THD (so, “total” = 10). There are other types of distortion such as intermodulation distortion (IMD) that happens when two different signals are distorted to create non-harmonic terms but those are not included in this simplified model. For a discussion on THD and IMD, see this thread https://www.audiosciencereview.com/...armonic-and-intermodulation-distortion.25436/ The equations relating THD and IMD are this post: https://www.audiosciencereview.com/...odulation-distortion.25436/page-2#post-878301 Signal-to-noise ratio, SNR, does not include harmonic distortion so really is just signal to noise. Jitter sets the maximum SNR that can be achieved as -20log10(2*pi*fin*tj) where fin is the input frequency and tj the time jitter (amplitude and sampling frequency fall out of the equation). There are some caveats when measuring THD and SNR, however…
The first catch is that there will always be a little noise at the harmonic frequencies, and there is no easy way to exclude that bit of noise. (There are mathematical schemes that let instruments exclude most of the noise.) Distortion is very low when the signal level is very small, so at low levels noise tends to dominate the THD measurement. Another catch is that SNR includes non-harmonic distortion like power supply noise, clock noise, crosstalk, and so forth. Again, there is no easy way to exclude these terms, so “noise” in the SNR measurement includes everything but the fundamental signal and its harmonics. The signal-to-noise-and-distortion ratio, SINAD, includes THD and noise (THD+N) – it is the ratio of the signal to everything else. This article only considers harmonic distortion and random noise from the blocks; no other error sources are included. In the real world, the nature of the noise and distortion also affects the sound, along with those other sources not included in this simplified analysis.
I first created a model of a single block including noise and distortion as independent parameters, and a set of plots to help see the results. This also makes it easier to see how distortion and noise affect each other in the measurements. The distortion model is a tanh() function typical of a differential amplifier using bipolar transistors (this varies with device and amplifier topology; I used what I am most familiar with). The added noise is normal Gaussian noise typical of most circuits and is uncorrelated (not related to) the signal. While not strictly true, the model assumes noise is a constant and distortion increases with signal level. This is a reasonable if simplified approximation of how most real circuits operate.
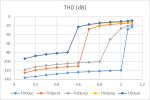
First is a plot showing only distortion; there is no noise added to the signal. For this model, target THD was 100 dB at full scale input (Vin) around 1V. You can see how THD rises smoothly until the amplifier begins to clip just before 1 V. No special low-level distortion such as crossover distortion is included in the model. The SNR is set by the mathematical computational limits of the program (Python) and computer (Windows PC) and is basically a flat line at the limits of the mathematical noise floor until the signal clips. Since there is effectively no noise, SINAD is the same curve as THD (though changed in polarity since THD is usually expressed as a negative number and SNR/SINAD as positive).
Figure 2: Distortion Sweep without Noise
The next plots show noise alone with no added distortion, and without clipping. The SNR target was 120 dB at full scale. At low signal levels, the noise is a large fraction of the signal, so SNR is low. As the signal level (volume) increases, the noise stays the same, so SNR rises. Since there is no distortion, SINAD follows the SNR curve. Notice THD is not 0%; this is because there is a little noise in each harmonic bin (the noise is “everywhere” and so a little bit ends up at each harmonic frequency) so the THD curve looks like the SNR curve (in the opposite direction since the sign is reversed). Because THD only looks at ten harmonic frequencies, and SNR looks at all the other frequencies, THD is lower (better) than SNR.
Figure 3: Noise Sweep without Distortion
Here are the plots when both harmonic distortion and noise are included. This is more interesting and similar to what real measurements often show. At low signal levels, distortion is very low, and noise dominates the measurement so the little bit of noise in the harmonic bins (at the harmonic distortion frequencies 2…10 times the signal frequency) leads to rising THD. Note that the THD level is still lower than the total noise, since only ten frequencies are included in the THD plot so there is less energy than the total noise overall all other frequencies. At around 40 mV in this example, distortion begins to exceed noise, and the THD curve begins to reflect the actual distortion of the signal and not just noise. SNR peaks around 120 dB as intended, and THD around -100 dB, at full scale output just before the signal clips. SINAD follows the SNR curve until THD begins to exceed the noise level, at which point the SINAD curve bends down a little as distortion begins to dominate. Hard clipping sets in above full-scale output and everything “crashes”.
Figure 4: Distortion + Noise Sweep
Finally, this first section ends with a couple of figures showing the signal behind the plots above. First is for Vin = 0.5 V, below clipping and near maximum (best) SINAD. The effective sampling rate is >1 MS/s (sampling frequency is 1.024 MHz) and bit resolution is “infinite” (limited only by the computer). A 1 kHz signal is applied. The upper plots show the entire acquisition (measurement) time, and a single cycle of the output signal (Vo). The bottom plots show the complete FFT spectrum of 512 kHz and restricted to 25 kHz to show the audio band. The noise floor is essentially constant and enough to create 120 dB SNR at full scale, and only a small bit of 2nd- and 3rd-harmonic distortion terms are visible. For this input, THD = -107.8 dB, SNR = 114.0 dB, and SINAD = 106.9 dB. When comparing values in dB, a difference of 10 dB between SNR and THD changes the SINAD by about 1 dB. If both THD and SNR are equal, the resulting SINAD will be about 3 dB worse than the individual numbers.
Figure 5: Output Plots for Vin = 0.5 V (unclipped)
Below is the same set of plots for Vin = 1.26 V, past the 1 V clipping point. Notice how the top and bottom of Vo are clipped (squared off), and now a “spray” of harmonics are visible in the frequency spectrum (FFT). At this level, THD = -21.1 dB, SNR = 45.0 dB, and SINAD = 21.1 dB.
Figure 6: Output Plots for Vin = 1.26 V (clipped)
Hopefully this provides some insight into how noise and distortion will influence the output performance, and how they are related. At very low signal levels noise tends to determine the SINAD, and at high signal levels distortion (THD) dominates. There is an implicit trade that carries through the signal chain: for the highest SNR, use the highest signal level; for the lowest distortion, use the smallest signal level. Finding the optimum signal level through a cascade (chain) of blocks requires knowing the noise and distortion performance of each block as well as the listener’s desired maximum output level.
Last edited:
")