- Thread Starter
- #21
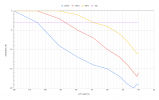
And the theory matches my expectations.Your entire setup used for measuring and for listening to music needs more detailed explanations. Same as in that other forum where people don't like to measure things as much as here (according to your perception).
Theory of low-pass (and high-pass) filters has been explained in some detail.
Ignore the measurements. I did the measurements only after my ears detected something suspicious. Read below.What is still up to debate is how you did perform your measurements
You would expect 200Hz to be get quiter by a noticable amount when you move the cutoff filter from 80Hz to 40 Hz.and why you even thinks there's something wrong with your BK electronics XXLS400.
My ears tell me it's not the case with my sub, the spl/loudness stays the same when I change the cut off frequency from 80 to 40 Hz.
I didn't trust my ears, so I did the measurements which confirmed what I hear.
Anyway, everyone here is saying that's not a normal, there should be at least 6dB, sine say 12 or 24dB which should be easy to hear.
If you think that I should not hear the difference between 80hz and 40 hz cutoff frequencies, please explain why.
Also, is there any chance you can do a hearing test with your sub and confirm it's behaviour. You don't have to measure, I will trust your ears. Easy to test.
Go to https://onlinetonegenerator.com/ on your phone/pc/mac and stream 200Hz to your sub.
Then rotate the cutoff filter knob and report if the sound coming out of your sub stays the same for at least one octave at lowest frequencies. If not, my sub is broken.
Last edited:
")