Sure, thanks!Something like Acourate or Audiolense or even rePhase may (*partially) -- at the cost of significant FIR time delay and possible ringing -- be able to reduce some of the SPL loss by equalizing the phase. Perhaps it could work reasonably well between 150-200 Hz... however, the phase correction would only be limited at the listening position, and could cause issues elsewhere in the room. Post your left and right mdat measurement if you want me to check the phase difference...

-
WANTED: Happy members who like to discuss audio and other topics related to our interest. Desire to learn and share knowledge of science required. There are many reviews of audio hardware and expert members to help answer your questions. Click here to have your audio equipment measured for free!
You are using an out of date browser. It may not display this or other websites correctly.
You should upgrade or use an alternative browser.
You should upgrade or use an alternative browser.
Share your in-room measurements?
- Thread starter thefsb
- Start date
ernestcarl
Major Contributor
Sure, thanks!
MMM measurements do not have the phase information. Regular sweeps are needed to look at the time information.
Looks like so, the phase will Boost or cancel out some frequencies. But in my experience I would say just leave it alone. As you rarely have exact sound at the spot with both speakers having same amplitude to create the cancellation.Phase response of the left and right speakers likely exceed 90 degrees so they effectively cancel each other out (to varying degrees) at certain narrow areas -- it's likely related to the room modes and boundary interferences peculiar to your physical arrangement in the space.
ernestcarl
Major Contributor
Looks like so, the phase will Boost or cancel out some frequencies. But in my experience I would say just leave it alone. As you rarely have exact sound at the spot with both speakers having same amplitude to create the cancellation.
I would tend to agree. But it would be interesting to look at the time information, nevertheless.
There you go. BTW, now I see in the sweeps the dips are also there...MMM measurements do not have the phase information. Regular sweeps are needed to look at the time information.
Attachments
ernestcarl
Major Contributor
There you go. BTW, now I see in the sweeps the dips are also there...
Doesn't look like there should be any big cancellation anywhere in your summed L+R sweeps...
The phase responses in the bass region already match well.
edit: eh, forgot the smoothing...
Vector average of LR (IR start time aligned) seems to add-up without any additional big dips. *It would appear that the dips seen in the bass are very much position dependent in your case. A wide (in contrast to a narrow) MMM will mask this issue.
BUT, wait, what is also going on with that HF shelving? Very strange...
Attachments
Last edited:
I would disregard the high frequencies, I often get that Slope in the measurements when measuring sweeps, someone suggested might be due to the calibration file...Doesn't look like there should be any big cancellation anywhere in your summed L+R sweeps...
View attachment 195102
The phase responses in the bass region already match well.
edit: eh, I forgot to remove the smoothing! wait...
View attachment 195105
Vector average of LR (IR start time aligned) seems to add-up without any big dips.
BUT, wait, what is also going on with that HF shelving? Very strange...
What's the reason you haven't filled the 81 Hz dip?I just use Audyssey EQ of subs at the moment, reducing a 47 Hz main peak (below 100 Hz). No EQ above 100 Hz.
View attachment 195085
What's the reason you haven't filled the 81 Hz dip?
It’s a null at LP.
ernestcarl
Major Contributor
I modified the mixed phase xo EQ of my setup as originally depicted here: 4 microphone positions in the room - RTA PN steady
2.1 mch mode

Image capture within REW's 'alignment tool'
Sealing the ports of the front monitors helped to make its phase response just a tad bit more compliant and easier to "EQ-fit" with my sealed sub's phase response. Some FIR phase correction was applied to the front speakers in order to keep it close to its original minimum phase response post xo EQ.
The previous xo EQ had less group delay overall, but was unable to fix a narrow dip around 125Hz of the main LR speakers' bass response. With the new xo EQ, at least in the MLP, it's now effectively filled-in by the sub.
No boosting EQ is applied anywhere except a 1 dB peak filter between 1-2 kHz
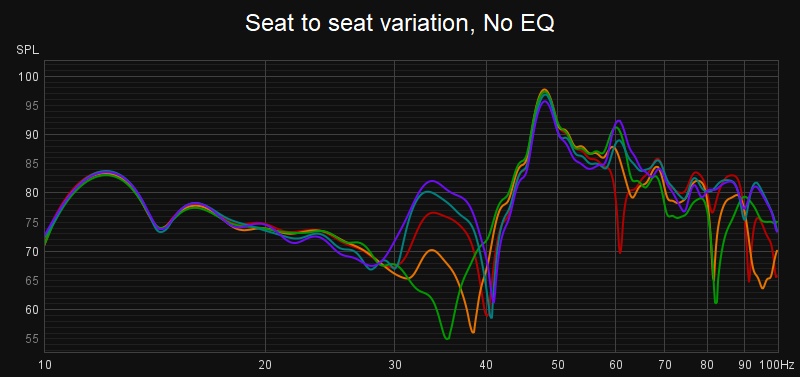
Previous multi-mic position measurements show the greatest seat-to-seat variation between 90-200 Hz.
"pseudo-surround" 4.1ch upmix mode

In the sitting positions to the farther ends of the couch, either left or right speaker is anywhere between 20-30 degrees off-axis -- and average L+R response should be close to 25 degrees.
New xo EQ measurements show a reduced overall frequency magnitude energy loss between 80-150 Hz.

GD or peak energy time in the bass has increased by a few milliseconds
There's only a single sub used in this setup. Adding any more subs in the room to reduce seat-to-seat variation appears to be unnecessary to me; and I also do not require any more extra sub bass SPL.
Changing the wavelet spectrogram's amplitude setting to Linear Peak instead makes the (effectively filtered) sub-mains "alignment" easier to see somewhat:

What appears to be a "medium-strength" reflection around 20 ms is just the delayed and matrixed, de-correlated pseudo-surround signal -- it's also visible in the next graphs around the same 20 ms time.

Bass peak is about 16ms late in relation to the HF start time (red step response trace).

We see a slightly increased GD immediately after the ~125 Hz cancellation dip in the new xo setting, but the transition also appears smoother (minus the abrupt visible kink in the response seen in the green trace).
Finally... before and after frequency magnitude response doesn't really change much.

However, the clarity in the bass region drops a bit -- rather inconsequentially given it's already very high! -- this is due to the increased GD time.
-------------
*My previous early attempts at FIR phase correction (using rePhase) went overboard... wherein I found myself trying to excessively flatten the GD and phase instead of just simply maintaining things close to their original "minimum phase" form.
Below are the result from some of my past EQ "experiments" :
FDW 20 cycles

The step response looks "normalish" enough:

However, we can also see some unwanted pre-causal / pre-ringing ripples in the wavelet under 1 kHz:


*The last wavelet spectrogram ("mild" phase EQ) is from the same mixed phase xo EQ correction seen in the first animated GIF image of this post. Notably it is much cleaner.
2.1 mch mode
Image capture within REW's 'alignment tool'
Sealing the ports of the front monitors helped to make its phase response just a tad bit more compliant and easier to "EQ-fit" with my sealed sub's phase response. Some FIR phase correction was applied to the front speakers in order to keep it close to its original minimum phase response post xo EQ.
The previous xo EQ had less group delay overall, but was unable to fix a narrow dip around 125Hz of the main LR speakers' bass response. With the new xo EQ, at least in the MLP, it's now effectively filled-in by the sub.
No boosting EQ is applied anywhere except a 1 dB peak filter between 1-2 kHz
Previous multi-mic position measurements show the greatest seat-to-seat variation between 90-200 Hz.
"pseudo-surround" 4.1ch upmix mode
In the sitting positions to the farther ends of the couch, either left or right speaker is anywhere between 20-30 degrees off-axis -- and average L+R response should be close to 25 degrees.
New xo EQ measurements show a reduced overall frequency magnitude energy loss between 80-150 Hz.
GD or peak energy time in the bass has increased by a few milliseconds
There's only a single sub used in this setup. Adding any more subs in the room to reduce seat-to-seat variation appears to be unnecessary to me; and I also do not require any more extra sub bass SPL.
Changing the wavelet spectrogram's amplitude setting to Linear Peak instead makes the (effectively filtered) sub-mains "alignment" easier to see somewhat:
What appears to be a "medium-strength" reflection around 20 ms is just the delayed and matrixed, de-correlated pseudo-surround signal -- it's also visible in the next graphs around the same 20 ms time.
Bass peak is about 16ms late in relation to the HF start time (red step response trace).
We see a slightly increased GD immediately after the ~125 Hz cancellation dip in the new xo setting, but the transition also appears smoother (minus the abrupt visible kink in the response seen in the green trace).
Finally... before and after frequency magnitude response doesn't really change much.
However, the clarity in the bass region drops a bit -- rather inconsequentially given it's already very high! -- this is due to the increased GD time.
-------------
*My previous early attempts at FIR phase correction (using rePhase) went overboard... wherein I found myself trying to excessively flatten the GD and phase instead of just simply maintaining things close to their original "minimum phase" form.
Below are the result from some of my past EQ "experiments" :
FDW 20 cycles
The step response looks "normalish" enough:
However, we can also see some unwanted pre-causal / pre-ringing ripples in the wavelet under 1 kHz:
*The last wavelet spectrogram ("mild" phase EQ) is from the same mixed phase xo EQ correction seen in the first animated GIF image of this post. Notably it is much cleaner.
Last edited:
ernestcarl
Major Contributor
Simple minimum phase PEQs without any additional FIR DSP. Small delay of 0.3ms manually added to the mains. BR port of monitors remain closed. Much better when any noticeable delay is unacceptable for the application e.g. watching youtube videos or online streaming videos.


It would be nice if there were a way to integrate REW's EQ Window so that it could be easily used together with the 'Alignment Tool'.
There is no bass cut-off applied here, but the mains still perform fine without compression when set at "max" 0 dBFS sweeps. Sealing the ports and additional internal damping caused a ~3.5 to 4 dB loss of energy in the very low bass, I reckon.


Distortion would be equivalent to ~96 dB if taken at 1 meter distance. Oh, yeah, the right channel above seems to have less distortion, but this is partly due to the greater amount of subtractive EQ applied.

Above 8 kHz or so, the 1-inch horn tweeter starts to clip and/or limit (?) where the internal FIR DSP seems to also go into overdrive and produces a certain kind of weird, delayed "re-reflecting" bouncing-back sound. I know that the monitor's (Sceptre S8) DSP was designed to try to cancel or significantly reduce horn reflections coming back into throat -- maybe that has something to do with it, I dunno for sure... It's not an artifact that I've noticed with very loud listening volumes, though. And generally, I would shelve the HF a lot if playing at extreme SPL levels for the sake of my ears.
I used to apply some bit of boosting EQ in the bass, but the off-axis measurements got a little worse in other areas of the room -- and, anyhow, it's not really needed here.
It would be nice if there were a way to integrate REW's EQ Window so that it could be easily used together with the 'Alignment Tool'.
There is no bass cut-off applied here, but the mains still perform fine without compression when set at "max" 0 dBFS sweeps. Sealing the ports and additional internal damping caused a ~3.5 to 4 dB loss of energy in the very low bass, I reckon.
Distortion would be equivalent to ~96 dB if taken at 1 meter distance. Oh, yeah, the right channel above seems to have less distortion, but this is partly due to the greater amount of subtractive EQ applied.
Above 8 kHz or so, the 1-inch horn tweeter starts to clip and/or limit (?) where the internal FIR DSP seems to also go into overdrive and produces a certain kind of weird, delayed "re-reflecting" bouncing-back sound. I know that the monitor's (Sceptre S8) DSP was designed to try to cancel or significantly reduce horn reflections coming back into throat -- maybe that has something to do with it, I dunno for sure... It's not an artifact that I've noticed with very loud listening volumes, though. And generally, I would shelve the HF a lot if playing at extreme SPL levels for the sake of my ears.
I used to apply some bit of boosting EQ in the bass, but the off-axis measurements got a little worse in other areas of the room -- and, anyhow, it's not really needed here.
ernestcarl
Major Contributor
Certain none minimum-phase "issues" seen in the in-room measurements should be best left alone.
Why? Well, in terms of just EQ, if you measure elsewhere besides a single point in space or MLP, the response will not necessarily be any better -- sometimes much worse.
Sorry, but I'm going to be adding lots more images into this thread!
Bass-managed left and right front mains (LR) as well as surrounds (LsRs) as measured in the center MLP of my couch:


There is obviously an "issue" around 130 Hz -- esp. when applying a lot of frequency dependent windowing. Should this be fixed via EQ?
Phase and Time Alignment and EQ


Phase Responses in Detail


*Notice the abrupt phase kinks around 130 Hz? That's caused by the boundaries and placement of the speakers in the room.
Impulse Responses


The room not only mangles the in-room response of the speakers badly, but also that of the subwoofer. The IR start time of the sub is set at around 2 ms in relation to the fronts and surrounds.
Step Responses


Mixed phase EQ -- additional FIR only added to surrounds -- makes the responses more alike overall. The subwoofer's maximum phase peak is delayed by about 15 ms. *Notice some of the waviness in the last graph between fronts and surrounds above 2.5 ms equalized each other out. The last magnitude SPL graph traces of the BM fronts (red) and surrounds (brown) at the bottom-most graph posted at the end correspond with the step response very nicely.
Envelope Time Curve


Again, more similar and controlled post EQ.
Spectral Decay


Having the subwoofer augment the "satellite" speakers' very imperfect amplitude response in the bass is crucial. We see the bass is quite smooth and have no "major" visible (and audible) dips for the most part.
Group Delay


It should be obvious from the LR only and LsRs only graphs that the GD anomaly should not be force-fixed via EQ. FIR filters to correct this narrow and varying region requires very steep/high Q filters.
Wavelet Spectrograms


This is about as good as it will ever get for now. No significant visible signs of pre-causal ripples under t=0 as well. Both fronts (internal DSP) and surrounds (external) have some form of FIR filtering applied.
Multiple microphone positions set in the room -- RTA pink noise -- both "steady" and MMM


*last graph traces are all MMM and not "steady" (with pseudo-surround mode enabled)
Ignore the peak below 20 Hz. The room is sealed and pressurization in the room is sometimes exaggerated with RTA.
The last measurement set is with "pseudo-surround" DSP enabled. This essentially matrixes the LR inputs -- and decorrelates it as well -- playing the delayed signal 20 ms afterwards for an artificially induced pseudo-surround effect.
The MMM measurements are much more stable and evenly smooth.
I had to manually apply a 90 Hz linear phase HPF to the surrounds in this DSP mode, as well as get rid of the bass mixing below in order for there not to be any additional interference between channels in the bass.
FDW 15 cycles

It should be clear from the multi-mic measurements taken in more than one spot in the room that specific anomalies in the response should not be treated in isolation. EQ boosts and cuts should be applied with caution. Taking care of a single seat maximally with EQ is fine, but you have to know that there is always going to be a trade-off somewhere.
Why? Well, in terms of just EQ, if you measure elsewhere besides a single point in space or MLP, the response will not necessarily be any better -- sometimes much worse.
Sorry, but I'm going to be adding lots more images into this thread!
Bass-managed left and right front mains (LR) as well as surrounds (LsRs) as measured in the center MLP of my couch:
There is obviously an "issue" around 130 Hz -- esp. when applying a lot of frequency dependent windowing. Should this be fixed via EQ?
Phase and Time Alignment and EQ
Phase Responses in Detail
*Notice the abrupt phase kinks around 130 Hz? That's caused by the boundaries and placement of the speakers in the room.
Impulse Responses
The room not only mangles the in-room response of the speakers badly, but also that of the subwoofer. The IR start time of the sub is set at around 2 ms in relation to the fronts and surrounds.
Step Responses
Mixed phase EQ -- additional FIR only added to surrounds -- makes the responses more alike overall. The subwoofer's maximum phase peak is delayed by about 15 ms. *Notice some of the waviness in the last graph between fronts and surrounds above 2.5 ms equalized each other out. The last magnitude SPL graph traces of the BM fronts (red) and surrounds (brown) at the bottom-most graph posted at the end correspond with the step response very nicely.
Envelope Time Curve
Again, more similar and controlled post EQ.
Spectral Decay
Having the subwoofer augment the "satellite" speakers' very imperfect amplitude response in the bass is crucial. We see the bass is quite smooth and have no "major" visible (and audible) dips for the most part.
Group Delay
It should be obvious from the LR only and LsRs only graphs that the GD anomaly should not be force-fixed via EQ. FIR filters to correct this narrow and varying region requires very steep/high Q filters.
Wavelet Spectrograms
This is about as good as it will ever get for now. No significant visible signs of pre-causal ripples under t=0 as well. Both fronts (internal DSP) and surrounds (external) have some form of FIR filtering applied.
Multiple microphone positions set in the room -- RTA pink noise -- both "steady" and MMM
*last graph traces are all MMM and not "steady" (with pseudo-surround mode enabled)
Ignore the peak below 20 Hz. The room is sealed and pressurization in the room is sometimes exaggerated with RTA.
The last measurement set is with "pseudo-surround" DSP enabled. This essentially matrixes the LR inputs -- and decorrelates it as well -- playing the delayed signal 20 ms afterwards for an artificially induced pseudo-surround effect.
The MMM measurements are much more stable and evenly smooth.
I had to manually apply a 90 Hz linear phase HPF to the surrounds in this DSP mode, as well as get rid of the bass mixing below in order for there not to be any additional interference between channels in the bass.
FDW 15 cycles
It should be clear from the multi-mic measurements taken in more than one spot in the room that specific anomalies in the response should not be treated in isolation. EQ boosts and cuts should be applied with caution. Taking care of a single seat maximally with EQ is fine, but you have to know that there is always going to be a trade-off somewhere.
Last edited:
ernestcarl
Major Contributor
I swear no more after...
FDW 15 cycles


*The delayed pseudo-surround signal plays about 12 dB less in SPL level.
Delayed signal of the surrounds is quite visible in the ff. graphs:


FIR phase Correction applied to Surrounds:


rePhase created FIR filters


FDW 15 cycles
*The delayed pseudo-surround signal plays about 12 dB less in SPL level.
Delayed signal of the surrounds is quite visible in the ff. graphs:
FIR phase Correction applied to Surrounds:
rePhase created FIR filters
@ernestcarl
Could you please share how you figure out what part of the spectrum is behaving in a minimum phase way?
Could you please share how you figure out what part of the spectrum is behaving in a minimum phase way?
ernestcarl
Major Contributor
@ernestcarl
Could you please share how you figure out what part of the spectrum is behaving in a minimum phase way?
Here's just my visual way of determining what is non-MP and should be largely left un-equalized:
FDW 10 cycles
no FDW
These are only none minimum phase in relation to the listening position and room one is measuring in. Anechoically, and in the extreme-nearfield, the speaker measurements do not show such obvious abrupt kinks in the phase and GD -- esp. the excess phase & GD (white & yellow traces).
*I'd also cycle between frequency windowing settings (none, 5 , 7, 10, 15, 20 etc as well as smoothing options) and adjust the phase or timing offset to help make the traces be "readable" for me -- and others. Otherwise, raw unsmoothed measurements may be impossible to humanly intepret.
Last edited:
@ernestcarl seems like the null at 40Hz in some of my seats is not following minimum phase at that region. I don't have a room mode at 40Hz btw.


My current EQ does not do much at 40Hz. I didn't save my individual measurements of the subs so it's difficult to say whether that is the frequency where they're perfectly out of phase.

My current EQ does not do much at 40Hz. I didn't save my individual measurements of the subs so it's difficult to say whether that is the frequency where they're perfectly out of phase.
ernestcarl
Major Contributor
@ernestcarl seems like the null at 40Hz in some of my seats is not following minimum phase at that region. I don't have a room mode at 40Hz btw.
View attachment 197770
View attachment 197771
My current EQ does not do much at 40Hz. I didn't save my individual measurements of the subs so it's difficult to say whether that is the frequency where they're perfectly out of phase.
View attachment 197772
Yeah, can sort of understand why they say that such areas should be treated with great caution — something that should not be “automagically inverted” conveniently via powerful FIR correction tools.
bjmsam
Member
Does the frequency change with position due to boundary-induced comb filtering (proportional to quarter wavelength distance) as described in Do Room Modes Even Matter by Ethan Winer? My situation may be similar (see Frequency, Amplitude, Distance) so I'm eager to understand how to mitigate!@ernestcarl seems like the null at 40Hz in some of my seats is not following minimum phase at that region. I don't have a room mode at 40Hz btw.
ernestcarl
Major Contributor
Does the frequency change with position due to boundary-induced comb filtering (proportional to quarter wavelength distance) as described in Do Room Modes Even Matter by Ethan Winer? My situation may be similar (see Frequency, Amplitude, Distance) so I'm eager to understand how to mitigate!
Yep… boundary interferences, but also in combination with modes in the bass. To mitigate, there are five things I can think of: 1) optimal positioning 2) acoustic treatment 3) choose speakers that radiate much less energy to the sides, back, ceiling and/or floor 4) augment by overlapping affected area with a sub 5) careful EQ if desired but check the response at adjacent areas and elsewhere in the room; don’t expect simple EQ inversion applied to the in-room measurements at the MLP is all that’s needed to fix/correct the “room” — even if intelligently applied.
T
The article is speaking about listener boundary interference response. You cannot realistically do anything about that except accepting it as a fact of life.
Yep… boundary interferences, but also in combination with modes in the bass. To mitigate, there are five things I can think of: 1) optimal positioning 2) acoustic treatment 3) choose speakers that radiate much less energy to the sides, back, ceiling and/or floor 4) augment by overlapping affected area with a sub 5) careful EQ if desired but check the response at adjacent areas and elsewhere in the room; don’t expect simple EQ inversion applied to the in-room measurements at the MLP is all that’s needed to fix/correct the “room” — even if intelligently applied.
The article is speaking about listener boundary interference response. You cannot realistically do anything about that except accepting it as a fact of life.
Similar threads
- Replies
- 18
- Views
- 1K
- Replies
- 44
- Views
- 3K
- Replies
- 2
- Views
- 238
- Replies
- 21
- Views
- 2K
- Replies
- 4
- Views
- 579