• WANTED: Happy members who like to discuss audio and other topics related to our interest. Desire to learn and share knowledge of science required. There are many reviews of audio hardware and expert members to help answer your questions. Click here to have your audio equipment measured for free!

Room equalization through inverse delayed and attenuated bass signals

neRok

Senior Member
Joined
Oct 7, 2022
Messages
304
Likes
176
Location
Australia
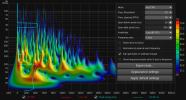
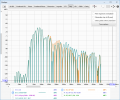
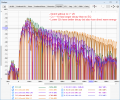
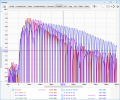
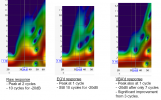
Just dropping a quick self-quote here to alert others to a different method of looking at the spectrogram - on the "burst decay" settings which shows time relative to frequency "periods" (cycles as I've been calling them in this thread). In the image I posted in the quote, which is of the same VBA results as above, it actually does look like another cancellation wave of 34Hz (the "cascade" of waves I mentioned) could cancel the remaining decay noise. Because periods 0 to 3 look the same width as the remaining energy from 4 to 7, which kind of suggests that 1 more greatly delayed wave will clear that up.
burst decay (1_3 octave, log SPL, 20dB range).png

That's a great graph you shared! I hadn't seen it before. Actually the span isn't seconds, it's periods ("cycles" of the frequency as I've been calling them). It basically takes a time based graph and divides it by the frequency. It's actually quite handy for showing delay relative to the frequencies length. It shows VBA working quite clearly.
View attachment 305692

PS: I'll get back to ernestcarl's recent post.

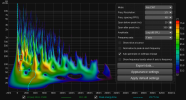
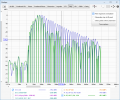
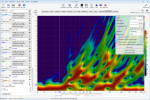
Edit: It worked! All I did was duplicate the previous VBA, delay it 4 cycles (1000/34*4), and adjusted its volume (-13dB). I added the 2 VBA's together, so now the main IR has 4 pulses in it, and that gives the following result.
it worked!.png
 
Last edited:
  • Like
Reactions: OCA

ernestcarl

Major Contributor
Joined
Sep 4, 2019
Messages
3,115
Likes
2,337
Location
Canada
Just to further validate the benefits of VBA

It's good that you attached the measurements this time so anyone can re-check and verify.

Now, I know I said I would recuse myself from this thread. But I have to re-iterate yet again how your examples are pretty lousy. :rolleyes:

1692006163660.png 1692006167600.png 1692006172353.png 1692006174907.png 1692006177650.png 1692006180101.png


I have been following this thread as I have tried a number of solutions mentioned here and have found them ineffective or improvement was small.

One can only sympathize...
 

Attachments

  • vba_test_z.mdat.zip
    1.9 MB · Views: 50

neRok

Senior Member
Joined
Oct 7, 2022
Messages
304
Likes
176
Location
Australia
It's good that you attached the measurements this time so anyone can re-check and verify.

Now, I know I said I would recuse myself from this thread. But I have to re-iterate yet again how your examples are pretty lousy. :rolleyes:
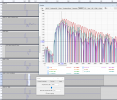
Interesting. How did you decide Q=9 for your EQ (compared to my Q=20)? Was it just to make a more accurate curve 30-40Hz? Because actually now I can see that other combos of dB+Q are even better at fixing 34Hz because it's possible to smooth out the phase and group delay (you can see these effects in the EQ tab by changing what the the predicted graph shows, yours and my EQ actually made the GD <0). Actually, whatever is happening here seems to be related to the orange area I circled in post #199 and labelled "It's interesting what has happened to the EQ method in this region". I'm going to export IR's for these EQ's and see what they are doing to the source wave in Audacity, to see if that holds clues. This has also opened up another avenue of VBA experimenting, by affecting the primary wave before the cancellation wave.

One other thing about the impulse graph you showed with VBA - the secondary impulse isn't bandpassed like it would actually have to be. If it were bandpassed, it would be so "short and long" that you wouldn't readily see its effects on the IR.

Edit: Here are the bandpassed IR's for the EQ methods.

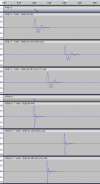
Comparing the EQ you came up with vs the standard response, I notice that the SPL of the waves 70-100ms are much lower than the EQ adjustment suggests. This suggests the EQ filter has applied some over time affect which could be construed as smearing, but is actually working as cancellation at the LP. And this follows through the full decay side of the graph. Also notice the big dips at ~150ms and ~350ms that weren't there before.
ov1.png
Now compare your EQ to the one I came up with quickly after paying attention to the phase and GD in the EQ tab. The improvements are even greater, but again, we are progressively losing direct wave energy.
ov2.png
Now compare that "optimal" EQ to the VBA I did yesterday, and there are clear improvements too. Interestingly, the resulting "plateaus" are at similar times, but not SPL.
ov3.png
And here is the single VBA vs the double VBA I recently did.
ov4.png
Edit: One more IR comparison, this time the raw response vs the "optimal" EQ with the plot normalised. Normalising doesn't really make sense in this context (because the EQ applies -dB shift), but at least the decay speed can be compared. Here it shows the raw response hits -30dB in ~400ms, but with the EQ it is -30dB in only ~230ms.
ov5.png
 
Last edited:

ernestcarl

Major Contributor
Joined
Sep 4, 2019
Messages
3,115
Likes
2,337
Location
Canada
How did you decide Q=9 for your EQ (compared to my Q=20)?

Psychoacoustics 101. Read up on how gain and q (bandwidth) affect the FR as well as studies of human hearing resolution in the bass region. Observe in the graphs how a PEQ looks like in the time domain e.g. phase, GD, ETC...

One other thing about the impulse graph you showed with VBA - the secondary impulse isn't bandpassed like it would actually have to be. If it were bandpassed, it would be so "short and long" that you wouldn't readily see its effects on the IR.

I merely showed what you yourself actually produced -- minus the bad equalization example.


--------


In case this was missed by anyone:

@UliBru had this to say about VBA:

"... it is not or no longer necessary to spend the extra work to create a VBA. The usual frequency response inversion already does the same job. Even more the (edit: "magnitude") inversion takes the reality into account much more."
 
Last edited:

neRok

Senior Member
Joined
Oct 7, 2022
Messages
304
Likes
176
Location
Australia
Psychoacoustics 101
Is it though? "Psychoacoustics ... More specifically, it is the branch of science studying the psychological responses associated with sound"
The measurement mic isn't recording the "psychoacoustic affect", it's measuring the result of Wave interference in our room.

"... it is not or no longer necessary to spend the extra work to create a VBA. The usual frequency response inversion already does the same job. Even more the (edit: "magnitude") inversion takes the reality into account much more."
Your link doesn't work (requires login), but I saw the comment the other day. But the VBA he suggested is the same as OCA was doing at the start of the thread, which was a single cancellation tone with ~1cycle delay from the same speaker. Has he considered cancel tones from different speakers and/or cascading cancel tones? Dirac ART is doing something more than basic EQ.
 

ernestcarl

Major Contributor
Joined
Sep 4, 2019
Messages
3,115
Likes
2,337
Location
Canada
There many more more accessible discussions about this and other related topics in @Floyd Toole's writings and @j_j lecture presentations. Very high gain and narrow q "room equalization" is not common practice even with professional system calibrators. In REW, Equivalent rectangular bandwidth (ERB) or Psychoacoustic smoothing (where previously 1/3 smoothing was the standard) would be closer to our ear's resolution in the bass. I would have preferred less of a cut myself, but I was just quickly eye-balling the VBA filter result you produced.

Sorry, but I have no idea why the thread was locked. Maybe a touchy issue given it was one of Acourate's "features".

Nope. Just the wrong link!
 
Last edited:

neRok

Senior Member
Joined
Oct 7, 2022
Messages
304
Likes
176
Location
Australia
There many more more accessible discussions about this and other related topics in @Floyd Toole's writings and @j_j lecture presentations. Very high gain and narrow q "room equalization" is not common practice even with professional system calibrators. I would have preferred less of a cut myself, but I was just quickly eye-balling the VBA filter result you produced.
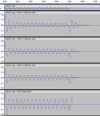
I have heard not to use high-Q EQ before, but I don't think there was ever a reason given (or at least explained fully). I was kind of under the impression that it would "delay" the direct wave, but now I can see the truth in that it smears the tone. This is evident after exporting IR's of the filters and convolving some tones, and now I can see the results look like VBA lol. Until my post #203 I would say this result was unexpected, but after seeing those results, it had to be this way.

34Hz + filters.png
 
OP
T

Tim Link

Addicted to Fun and Learning
Forum Donor
Joined
Apr 10, 2020
Messages
798
Likes
677
Location
Eugene, OR
I have heard not to use high-Q EQ before, but I don't think there was ever a reason given (or at least explained fully). I was kind of under the impression that it would "delay" the direct wave, but now I can see the truth in that it smears the tone. This is evident after exporting IR's of the filters and convolving some tones, and now I can see the results look like VBA lol. Until my post #203 I would say this result was unexpected, but after seeing those results, it had to be this way.

View attachment 305744
I had some experience this weekend with unexpected results of high Q EQ. I inadvertently made a high Q positive EQ by using FIR to knock the levels way down on my woofer. This essentially caused a deep notch to be highly elevated so it didn't look like a notch any more. Listening to that I noticed that there was a really loud standout note. It was the note where the notch used to be. I ended up having to EQ that back down to about the same notch depth that it was before to get it to sound right again. This was around 76 Hz, and I'm a little confused as to the cause of this notch. I have good reason to believe it is partly related to the way I folded the path in my bass horns, and perhaps the relatively small mouth size for the path length. But it really seems to light up the entire house structurally as well. In any case, it sounds quite natural and fairly even subjectively if I just let that notch be.
 

OCA

Addicted to Fun and Learning
Forum Donor
Joined
Feb 2, 2020
Messages
694
Likes
525
Location
Germany
I had some experience this weekend with unexpected results of high Q EQ. I inadvertently made a high Q positive EQ by using FIR to knock the levels way down on my woofer. This essentially caused a deep notch to be highly elevated so it didn't look like a notch any more. Listening to that I noticed that there was a really loud standout note. It was the note where the notch used to be. I ended up having to EQ that back down to about the same notch depth that it was before to get it to sound right again. This was around 76 Hz, and I'm a little confused as to the cause of this notch. I have good reason to believe it is partly related to the way I folded the path in my bass horns, and perhaps the relatively small mouth size for the path length. But it really seems to light up the entire house structurally as well. In any case, it sounds quite natural and fairly even subjectively if I just let that notch be.
Filter bandwidth can be whatever it takes if the target curve you're equalizing to is correct for your speakers. Room curve is a different story. REW auto EQ regularly feeds me with 20-25 Q filters below Schroeder's with great audible results. In fact, a lot of scholars are working on increasing filter resolution with methods like discrete prolate spheroidal filters etc.
 

ernestcarl

Major Contributor
Joined
Sep 4, 2019
Messages
3,115
Likes
2,337
Location
Canada
Filter bandwidth can be whatever it takes if the target curve you're equalizing to is correct for your speakers. Room curve is a different story. REW auto EQ regularly feeds me with 20-25 Q filters below Schroeder's with great audible results. In fact, a lot of scholars are working on increasing filter resolution with methods like discrete prolate spheroidal filters etc.

1692056764489.png 1692056778550.png
From: The Discrete Prolate Spheroidal Filter as a Digital Signal Processing Tool

Too bad rePhase doesn't have this type of filter to test easily -- just out of curiousity.

But you gotta ask yourself if this is for a single filter, and what is the gain? Plus, are we primarily concerned about a room or speaker peak/notch? Perhaps, it is, in fact, part of a much larger set of (FIR and/or IIR) filters where the overall (negative) time-domain effect becomes smaller?

Suppose the peak or cut applied is less than or equal to 1 dB with said extremely narrow q of 25 (generic proportional) at around 100 Hz, how significant is that psychoacoustically? And, how about the resulting seat responses across the entire area of the couch? Probably its relevance diminishes or turns to zero.

Yeah, I've seen weird things going on many times before where REW churns out PEQs with 0 dB of gain as well as instances where several rather unnecessary very high Q filter entries were produced, yet I've always been able to manually modify/create far simpler PEQs that sound no worse or better in practice.
 
OP
T

Tim Link

Addicted to Fun and Learning
Forum Donor
Joined
Apr 10, 2020
Messages
798
Likes
677
Location
Eugene, OR
I tried a nearfield correction of the bass horn. The FIR filter was able to produce an excellent nearfield response, with super high clarity where there was not before the filter. This was with the microphone right up between two horn mouths. The frequency response was excellent too, with the notch entirely removed. This was encouraging, but did not at all translate to the listening position, which measured very poorly, with very low clarity and very poor frequency response. The deep notch was back with a vengeance. I didn't bother trying to listen to it. This doesn't surprise me too much because I've experimented with measuring the response down into the horn, and depending on where the mic. is in the horn, the notch is at a different place. Sitting in the room, I am actually still in the horn flare.
 

OCA

Addicted to Fun and Learning
Forum Donor
Joined
Feb 2, 2020
Messages
694
Likes
525
Location
Germany
But you gotta ask yourself if this is for a single filter, and what is the gain?
At times when I'm over dedicated, I go and compare C80 clarity each time turning every rew filter on/off one by one and then go create their linear phase versions in rephase and check back :). I know clarity is for concert halls and is quite useless for rooms (and I heard that from John himself), a ratio of early to late energy feels safe to me. I totally agree with you about the audibility though. And I am single so don't really care much about the area outside LP (only check if there's more bass outside LP to avoid neighbor interactions).

PA smoothing requires high SPL target curve in the bass region or else dims the bass too much for my taste. I use it above Schoroders only.

In my system, after some "manual" brute force testing, I concluded C80 clarity increases the most with

20-200Hz-1/48 smoothing-no fdw-5dB boost ind./overall boost limit
200-500Hz pa smoothing, no boost allowed (still working on the best windowing for that area and I am open to ideas, was checking wavelets today)
500-20000HZ, pa smoothing, 0 db boost, speaker distances to LP/343 ms right window size applied (20000 shouldn't scare you, with this kind of windowing, it'll hardly ever eq above 1000Hz)

Btw, variable q over 200hz option harmed clarity at nearly all combinations. Beware!

But, the best improvement of late came to my system from eq'ing for the actual response of my speakers. I had to create a txt file with the exact polynomial and roll offs of my speakers response curve which I found in a magazine test. Whatever the room adds/subtracts from that, I can force back with EQ, but obviously this is killing a lot of bass below 35Hz which in fact should not be there but I used to abuse that and draw the curve from the top of that and yes get more bass but I think anything outside your speakers capabilities come at a cost.

Believe it or not, I did the same for my Focal Dome Flax ceiling speakers today. They are toy like speakers and when I created their actual response curves and eq'ed them to that, even Audyssey sounded better. These speakers are marketed as 80Hz bass limit and the graphs are full of SPL around 80Hz, too but the test says: "The –3-dB point is at 133 Hz, and the –6-dB point is at 112 Hz" and this is clearly a speaker with a bass roll off starting at (least) 120Hz. Once I EQ'ed them for that curve and crossed them over at 120Hz, now they sing.

So, my new motto is EQ for the actual response curve of your speakers, XO them for their actual capacity and filter out the room.
 
Last edited:

OCA

Addicted to Fun and Learning
Forum Donor
Joined
Feb 2, 2020
Messages
694
Likes
525
Location
Germany
Too bad rePhase doesn't have this type of filter to test easily
This is too optimistic, but at least a Kaiser window could have been available - maybe REW adds it some day - cosine windowing was added recently and unwillingly on huge demand!

The author didn't touch rephase since 2019! He's in this forum btw, occasionally posting usually about DIY.
 

neRok

Senior Member
Joined
Oct 7, 2022
Messages
304
Likes
176
Location
Australia
I tried a nearfield correction of the bass horn. The FIR filter was able to produce an excellent nearfield response, with super high clarity where there was not before the filter. This was with the microphone right up between two horn mouths. The frequency response was excellent too, with the notch entirely removed. This was encouraging, but did not at all translate to the listening position, which measured very poorly, with very low clarity and very poor frequency response. The deep notch was back with a vengeance. I didn't bother trying to listen to it. This doesn't surprise me too much because I've experimented with measuring the response down into the horn, and depending on where the mic. is in the horn, the notch is at a different place. Sitting in the room, I am actually still in the horn flare.
What frequency is the notch? Have you put your room layout in to REW Room Sim to see if there is a null at the same place? Have you used filtered IR to see the timing of reflections at that frequency?

So, my new motto is EQ for the actual response curve of your speakers
Yes, it's not good to try add energy where your speakers are not capable by design. I've got spin data for my speakers, so the estimated in room response is a good comparison point for what the room is doing. I gave instructions to another user on how to do it yesterday: https://www.audiosciencereview.com/...rt-for-improvement-of-bass.46751/post-1686109

A 100 Hz tone period/cycle = 10 ms and is registered under 30 ms. In a small room this would have traveled the room and impinged on the ears a dozen times coming from several different directions at different arrival times way before detecting its presence -- pitch and loudness is not even yet determined at this point.
This is what I noticed on my previous post #198 when I drew the reflection lengths in autocad = that the timing window between the direct wave and the back wave are very short. So yes, all those reflections from surfaces arrive very quickly, and when considering the length of time of low frequencies that means at best there is only 1 peak heard between the direct wave and the back wave. This is all "compressed" in to the IR plot though, because what we hear is the "wave interference" (the sum of all waves at that moment), and not each wave individually.

The minor details/effects of these peaking filter implementations is surprising to me. At best I thought the filters were simply a gain adjustment over a target area, and at worst they might delay the targeted frequencies and/or phase shift them in place, but I didn't consider they have "echos". It's those echos that are helping the decay in my tests in this thread, like VBA tries to echo. It seems from that graphic that the Prolate Spheroidal filter is trying to be just a pure gain adjustment, which means it would actually be worse at cancelling room reflections, for it has no "after affects".

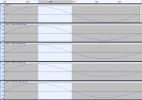
I did some more testing of the PK filters to check for pre-ringing, and to see if min-phase in REW did anything. Neither made a difference beyond shifting the ref time.
prering test.png

I was surprised to see that 100Hz was being affected so much, considering it is almost outside the "area" of the PK filter. So I tested a couple of even higher frequencies;
high freq test.png
There are "after affects" on both those higher frequencies, and both actually clip on the valley. Now I'm feeling like filters are a mistake to use at all! Who knows what minute affects they are having to various parts of a song? Room treatment (and room design if considering flush speakers) really seems to be the best way to go about things, because it keeps the signal side "pure". DBA still remains valid because it is outputting the same "pure" signal.

And on the 1st screenshot, look at what the filter did to the 1 cycle source wave - it destroyed the valley on the outputted wave. I don't like that. If my speakers anechoic response is flat at this frequency, then I should be able to send it a perfect full power direct wave. I want the corrections to be made to the in room reflections, not to the source/direct wave. Also the echo waves don't look too dissimilar to some of the bandpassed echo IR's I've tested in the past (the delayed IR having it's own echos due to the bandpass filters), but the echos of this PK filter are pretty unique. I'm wondering if a PK filter applied to the duplicate IR is a good idea? I also plan to test if phase corrections to the primary wave are a good idea on their own. Maybe bandpassing or shelving right at the room mode frequencies is a good idea? There's lots to test.

Edit: One more thing I thought I better look at a bit more closely was the phase shift of the source wave. It is very subtle. Maybe degree wise that's all it is, but like I wondered earlier in the thread, I wonder if the REW reported phase is that of the loudest wave. By having echos, their direct wave will merge with the original waves reflections and that could cause a phase shift at the point of "peak SPL", and maybe that is the reported phase shift and/or group delay time?
34Hz EQ phase shift.png

Edit2: Have checked out some other filters that REW EQ offers. Only Notch and Allpass seem relevant.
notch+ap convolutions.png
Notch does all sorts to the room IR depending upon it's Q, but the convolved tone just looks a "cascaded echo". So that might be a good one to apply to bandpassed+delayed signal.
notch IRs.png
Allpass is similar at high-Q's, but at low Q's it just seem to be adding a phase shifted tone on top of the original tone with a certain delay, so the end result is a shifted tone (delayed).
AP IRs (+Q).png

Edit3: Tried another experiment where I looked at the convolved IR of a PK filter, then designed a VBA IR that looked and gave similar results, and confirmed it convolved the way I designed it (as seen in Audacity part of the screenshot). If I compare the PK and VBA IR's, they both offer cancellation in the decay, but PK is stronger in this regard (owing to its more complex echo). But VBA maintains the direct waves strength. However, I have yet to bandpass the VBA in any way, so that might make the VBA "echo" too?
IRs of EQ vs VBA equivalent.png
 
Last edited:

OCA

Addicted to Fun and Learning
Forum Donor
Joined
Feb 2, 2020
Messages
694
Likes
525
Location
Germany
Prolate Spheroidal filter is trying to be just a pure gain adjustment, which means it would actually be worse at cancelling room reflections, for it has no "after affects".
Pre/post ringing is something they try to minimize with a filter's design. I don't have a technical explanation for this but I also feel, when you target speaker spin data, REW EQ filters work better, ie very easily smooth out the response on the target with just a few filters. I know that REW auto EQ algorithm was revamped recently but I don't know what was exactly done.
 

neRok

Senior Member
Joined
Oct 7, 2022
Messages
304
Likes
176
Location
Australia
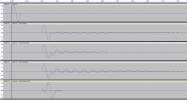
Thought I better do 1 more check for EQ vs VBA, this time long tones convolved in room.

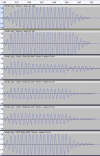
Here are the long tones convolved with EQ or VBA (without the room, thus this could be considered the source stream coming out of your DSP). Notice the EQ tones have lower amplitude initial wave along with greatly SPL reduced secondary waves. It's not bad that the secondary waves are SPL reduced, because that stops the in-room gain over time, but the level might be reduced too strongly.
EQ vs VBA long tones, without room.png

Now here are those tones further convolved with the room;
EQ vs VBA long tones, with room.png
The top result is normal SPL without any EQ. Notice that at its loudest point that it is ~6dB louder than the VBA at the bottom. The 3rd row is with a higher Q factor (9) and actually loses SPL over time. It also suffers from serious post-ringing. The 4th and 5th rows are with lower Q (4) and their SPL is more stable, however they are ~6dB lower in room than the VBA example at the bottom.

So the EQ method has lost 6dB overall (the EQ caused ~3dB loss to the first crest in the signal, and then after cancellations in room it loses another 3dB SPL). Perhaps 3dB could be regained in the signal with another EQ, like a shelf? Possibly this will introduce other timing artifacts? Also it may cause clipping at other frequencies. Even if the signal side was restored, it would still leave the room -3dB. Maybe that -3dB is desirable though? This is a room mode after all.

Pre/post ringing is something they try to minimize with a filter's design.
Yes, that makes sense from a stand point of "fix 1 problem and don't cause another". But in this strange case, the only reason PK filter is improving the decay is because of the normally "undesirable" post ringing.
 

dasdoing

Major Contributor
Joined
May 20, 2020
Messages
4,316
Likes
2,788
Location
Salvador-Bahia-Brasil
most notches are "maximum phase"....the more you boost them, the more they ring.
here is L0 with a minimum phase total inversion:

1692091864561.png


with minimum phase filters they are best left alone.
they can be corrected with FIR, but that is very complicated these notches are very position specific.

the only real way to deal with excess phase is to treat the room.
when I do the above mentioned exercise in my system, for example I get this

1692092789107.png
 

OCA

Addicted to Fun and Learning
Forum Donor
Joined
Feb 2, 2020
Messages
694
Likes
525
Location
Germany
the only real way to deal with excess phase is to treat the room.
:) this is an unfair comment for all digital correction we have been working on! Every correctly applied digital filter will somewhat improve excess phase. Did you watch my latest video on phase correction?

On a VERY different note @ernestcarl , I remember you are using JRiver for your DSP and I have a question for you. I haven't upgraded my license since v24. Frankly, I don't even remember their config file convolution system very well but I remember it was very powerful. I've just received an email from them for the upcoming v31 and they claim it can now play Dolby Atmos files. The only way I knew of to apply FIR filters to an Atmos system to this day was to "cavernize" Atmos files and be able to use filters for atmos channels but this requires file conversion of everything you will ever play in your PC first. Do you have any info whether it will be possible to filter and play Atmos with Jriver 31?
 

dingdong3

Member
Joined
Nov 29, 2022
Messages
12
Likes
2
the only real way to deal with excess phase is to treat the room.
I agree with this. DRC allows you to feel and hear some benefits and changes. But the problematic low-pitched energy is not lost. Likewise, the initial reflection of the mid- and high-pitched ranges of about 500 Hz or more is just timing control, and it does not return the already distorted direct sound back.
If you hear the actual sound improvement while eliminating energy with a DBA or more (at least two to as many as eight) subwoofer, you can see the limitations of DRC.

This is the point. Energy is not lost. (Low pitch area we don't need)
There is no slight improvement in the low-pitched area.
If you cancel Jung Jae-pa correctly, you can feel dynamic changes unconditionally.
Go around the room. Can you hear a different low tone from the listening position?
Then there's energy left. DRC can't get rid of this.
Would it be okay to listen to it only in the listening position?
I doubt it.
The low notes that we hear are like actually listening to a room.
If you don't get rid of that energy no matter how hard you try, you'll hear a bad low tone.

So let me rank them.

5th place/ Nothing Room treatment, Improper placement of speakers
: This is the worst.
4th place/ Nothing Room treatment, Slight speaker placement (where SBIR is considered and initial reflection can be controlled as much as possible)
: This is what you can do in general. It's better than the one above.
3rd place/ Nothing Room treatment, Slight speaker placement + with DRC(Auto or Manual whatever)
: Not bad. But can't hear clean sound because I didn't control the initial reflection properly within 10ms. It varies from person to person, but it also sounds very hectic. There are no clear images. Of course, if the timing is adjusted through phase correction, the overall balance is correct. But it's still distorted, and the clarity of the sound is very low.
2nd place/ Room treatment(Room size, according to RT60), best placement of speakers, NO DRC, Multi-subwoofer can be operated to effectively control under 80hz.
: If you can control the initial reflection within 10ms from the -25db line, you'll hear a very clear and clean sound. And you can already hear soft, fun, and stimulating sounds without applying any EQ. Because we're not listening to the speakers, we're listening to the room that's made up.
1st place/ Room treatment + Speakers placement + with DRC
: It's Perfect. It's real sound.

I am positive about DRC, but its limits are too clear.
I can't determine the sound with numbers
Suppose it's from 1 to 100
DRC can only control 1 to 10. It can never be reached beyond that area.
I think it's reachable because I've never heard or measured more than 10 sounds.
Even considering Nearfield, Farfield, and Freefield
It's listening to the room. If you want sound improvements from 10 to 100, it's time to start room acoustic.
 
Top Bottom