• WANTED: Happy members who like to discuss audio and other topics related to our interest. Desire to learn and share knowledge of science required. There are many reviews of audio hardware and expert members to help answer your questions. Click here to have your audio equipment measured for free!

REW SPL plot can be a bit of a liar (is only correct for 1 cycle tone)

neRok

Senior Member
Joined
Oct 7, 2022
Messages
304
Likes
175
Location
Australia
I was just reviewing my own speaker measurements, for my right speaker in particular, which happens to sit next to a window recess. I saw strange areas on the Decay plot that didn't align with room modes, like the 0/20/40ms slices being lower SPL than the 60+ms slices. So I picked one to investigate: 120Hz. Here is the decay plot with Room Sim;
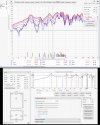
120hz decay.jpg
The SPL&Phase plot and the spectrogram don't reveal the full extent of the issue;
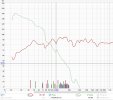
120Hz freq+phase.jpg 120Hz spectro.jpg
But I exported the IR and convolved it with a 1 cycle tone, and a long tone (~0.5sec), and wow, massive issue detected! The long tone reveals it is being cancelled over time, whereas ideally the SPL should be continuous.
120Hz convolved.jpg
But the REW SPL number shows that the SPL is quite comparable to other areas of non-peaking SPL. So I ran some new sweeps with differing lengths in REW, to see if that made a difference. It didn't. So then I used "Generator" and "SPL meter" to record the SPL of a continuous 120Hz tone;
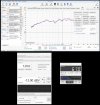
120Hz.jpg
A dismal 67dB, when REW suggests it should be nearly 81dB. That's a 14dB difference. And just to prove I was measuring correctly, I tested another frequency that looked "normal", and the results were normal (near the correct volume). So this isn't a "testing error";
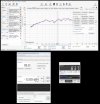
95Hz.jpg
I went back to Audacity to check what the long-term SPL was reported as, and it's ~16dB lower, so pretty close to the ~14dB difference I just measured.
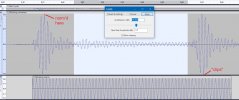
120Hz conv SPL.jpg

Next I wondered what is causing this issue. I foreshadowed the issue at the start of the post when I mentioned the window recess (it's a double brick wall). But first I did 343/120/4 to get the relevant 1/4 cycle wave length of 120Hz, which is 715mm. And guess how far the one of the window's edges is away from the speaker: ~715mm. And so I measured to the opposite edge, which is ~450mm = 190Hz = a strange area on the decay plot. And the top edge (the lintel) is ~1.1m and shows up on the decay plot as the 78Hz issue.
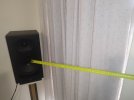
IMG_20230822_132116 (Medium).jpg
(BTW, I took the above measures with the blind up (the blind is "in" the recess), but took a photo with it down to block some sunlight for the photo - not that I think the blind will do anything at these frequencies.)

So that's all I've discovered today. I had noticed the "in room" SPL discrepancy of a 1 cycle vs many cycle tone in the course of the VBA thread we have going (here's a recent post mentioning it), but it was only "simulations". Here in this thread I have shown it in affect in my room. I haven't tried any sort of VBA method to "cancel the cancel" yet.

Actually I think it would be better to just "fix" this window properly. I would like to keep the light it provides though, so I wonder if it would sufficient to use a full sheet of glass or acrylic to make the internal surface flush? Or would I have to fill the "void"?

Lastly, I wonder about REW. I get that a REW sweep is based upon a short sample of each frequency (not sure if it's a dirac impulse or a 1 cycle tone or what exactly), and that the IR it captures/measures technically implies the affects I discovered above, but it doesn't actually show this on any SPL graph AFAIK. This post shows a problem causing less SPL over time, but room modes for example actually gain SPL over time (until the old waves become irrelevant, and the SPL becomes steady). Maybe there is a way to see this in REW that I am not aware of? Or maybe a graph needs adding to show this affect?
 
Last edited:

RayDunzl

Grand Contributor
Central Scrutinizer
Joined
Mar 9, 2016
Messages
13,250
Likes
17,199
Location
Riverview FL
Show the recorded 120Hz tone with dB display instead of linear, if you would:

index.php


Right click on the scale at the left to choose.
 
OP
N

neRok

Senior Member
Joined
Oct 7, 2022
Messages
304
Likes
175
Location
Australia
Right click on the scale at the left to choose.
This isn't a recorded tone, this is convolved tone (the source tone convolved with my rooms IR (the system transfer function), thus a "simulation" of a long tone played in my room). I haven't tried actually recording it. Is that worth doing? I figured the "SPL meter" was good enough to show the effect being in-effect.
 

RayDunzl

Grand Contributor
Central Scrutinizer
Joined
Mar 9, 2016
Messages
13,250
Likes
17,199
Location
Riverview FL
It looked like a recording... I misunderstood, then... Just wanted to see it with a visual closer to how we might hear it.

I haven't tried actually recording it. Is that worth doing? I figured the "SPL meter" was good enough to show the effect being in-effect.

Worth to see how it matches the simulation (or not). The SPL meter reading is probably informative enough in your experiment.
 

ozzy9832001

Senior Member
Joined
Feb 19, 2023
Messages
405
Likes
257
My windows do the same thing at 190hz and the glass resonates at 390hz, which is a near harmonic to the window cavities. My windows suck too because they never really feel like they are clamped down very hard when locked. I found that for the one nearest the speakers, I can place a 4" panel right up against the trim to help "block" it, but the other 3 are difficult, at best.

Unfortunately, the people who designed this house really, really loved windows. I got 4 of them.
 

JohnPM

Senior Member
Technical Expert
Joined
Apr 9, 2018
Messages
344
Likes
920
Location
UK
When you apply a single cycle at 120 Hz this is the input spectrum:

1692740526803.png


Here's what a 500ms burst of 120 Hz looks like:

1692740613330.png


The responses of a system to various tone bursts is not the system's transfer function. REW's SPL plot is an accurate view of the magnitude response of the system's transfer function.
 
OP
N

neRok

Senior Member
Joined
Oct 7, 2022
Messages
304
Likes
175
Location
Australia
When you apply a single cycle at 120 Hz this is the input spectrum:

1692740526803.png


Here's what a 500ms burst of 120 Hz looks like:

1692740613330.png
Thanks for your attention. Is this related to the "spectra of the tone bursts" you mentioned in my other/older thread? I'll read up on that soon.

REW's SPL plot is an accurate view of the magnitude response of the system's transfer function.
Yes, I imagine it is. But I can't be the only one that presumed the reported SPL is the SPL that you'll hear for tones of different length. There's no way laymen such as myself expect a 17dB difference between 2 tones in room when the SPL plot shows a 4dB difference.

Actually there's all sorts of similar problems that aren't revealed by any screens/plots in REW. Post #1 shows a speaker boundary reflection issue, but there's also the increasing gain of room modes over time, and speaker to speaker cancellations. After making this post I went through some old sweeps from when I was trying my speakers on my desk, and they were ~1.35m apart (on either side of my 48" monitor), so cancelling around 64Hz. Whilst there is a big dip on the reported SPL, it doesn't suggest that the SPL gets even more worse "over time" - 17dB worse!
kalis on desk - speaker cancellation.jpg
So that's showing that a 1 cycle tone is roughly the same SPL as the 1st cycle of a long tone, but then the long tone settles in at -17dB.

So many people like myself are trying to use REW to correct their system for music playback, and yet problems like those just described are "flying under the radar" (not readily revealed). I've got good speakers and a bad room, and I make DSP changes that look like improvements, and yet there are still songs that sound terrible. I've also commented that my music often sounds panned to the left, even though my speaker placement is very symmetrical, and the measurements are very similar SPL wise. Now that I convolved some long tones and see the cancellations affecting the right speaker "over time", my "panning" problem makes a lot more sense.

So whilst it might not be "correct" within the scope of measuring "system transfer functions", is it feasible for a graph to be added in REW that shows the "long term SPL"? I imagine it would have to convolve a long tone per frequency or band, and then measure the SPL after a certain time. So if the IR windows are 200,500=700ms total, then I guess it would have to convolve a 800ms tone and measure the peak SPL between 700-800ms (From: after the full window is in effect, To: before the source tone ends). If this was done at certain frequency intervals, and then overlayed with the normal SPL plot, it would really reveal where the "over time" problems are.

And whilst I've got your attention, I've been dabbling with the Filtered IR screen but find it quite restricting that you have to use the frequencies it offers. Could it be made so that any frequency can be input?
 
OP
N

neRok

Senior Member
Joined
Oct 7, 2022
Messages
304
Likes
175
Location
Australia
No. A sweep measurement measures the system's transfer function. That can be presented as an impulse response or magnitude and phase, they are equivalent. The REW primer has an explanation. To better understand the different results of convolving your various tone bursts it may help to look at the spectra of the tone bursts, then you can see what it is you are passing through the system (it isn't a single frequency).
Quoting this from the other thread. So I read "Frequency Spectrum of a Tone Burst" by "General Radio Company" in 1965. It explains the benefits of using a tone burst for testing as they were understood then. It seems like the method makes the target frequency stand out more compared to its surrounding frequencies/harmonics.

So is REW sweep doing something like that to make its measurements? And then the REW SPL plot shows the magnitude of the STF, which isn't representative of the SPL of a 1 or continuous cycle tone of the same source amplitude?

You also suggested I look at the "spectra" of the 120Hz long tone, so I looked at the spectrogram of it. I see the other frequencies you hint at.
120hz multiview.jpg
So there's more going on than just the desired tone, and the convolved result shows this too. But what are the implications of this? If I bandpass the convolved result, the output changes a little, but the general trends of the amplitude remains the same. Also the frequency of the peaks is broadly in time with the source frequency, with or without bandpassing.

I'm not sure what your spectrum plots are actually showing either. I think the shape makes sense now that I read the document I linked, but the SPL values don't. Why are both labelled "100.0dB peak" and then neither the Y scale nor the reported value in the top-right-corner reflect that? Is the 100dB reference to the amplitude of the source tone that produced the spectrum? And why does the peak of the spectrum not reach as high on the Y scale compared to the reported number?

Lastly, back on the practical side of things, if the measured SPL of 1 long bass tone is 17dB less than another long bass tone, then surely that's a problem? Especially when the "magnitude of the transfer function" suggests only a 4dB difference. The primer page says "The purpose of measurement software like REW is to measure transfer functions", and sure, that's what needs to be done. But it's called Room EQ Wizard, not Transfer Function Wizard, and so this differing SPL over time caused by the room seems like something that should be reported so that any such affects/phenomenon can be acknowledged by the user.
 

JohnPM

Senior Member
Technical Expert
Joined
Apr 9, 2018
Messages
344
Likes
920
Location
UK
I can't be the only one that presumed the reported SPL is the SPL that you'll hear for tones of different length
Perhaps, but that is an unusual interpretation. It is the SPL that would result for a continuous tone. That becomes clearer if you consider what it means to convolve a signal with an impulse response. That process is usually implemented by multiplying the spectra of the signal and impulse response and taking the inverse FFT of the result. If the spectrum of the signal has only a single frequency, as it would for a continuous tone, the result picks out the SPL of the transfer function at that frequency. Other signals with a broader spectrum will have an output that depends on a correspondingly broader portion of the system response. Roughly speaking the shorter the signal is in time the broader its spectrum will be, your single cycle tones have a very broad spectrum so it is wrong to expect the output to exhibit the behaviour of a continuous tone.

Regarding spectrum plots, the total energy in the signal is the sum of the energies in the frequencies that form its spectrum. If the spectrum has more than a single frequency the energy of the constituents will be lower than the total energy of the signal, the broader the spectrum the lower the energy of any individual part.

REW offers a variety of time-frequency plots to examine the behaviour of the system over time, including spectral decay, waterfalls, Fourier spectrograms and wavelet spectrograms.
 

ernestcarl

Major Contributor
Joined
Sep 4, 2019
Messages
3,113
Likes
2,330
Location
Canada
to have acourate transients in an untreated room is not possible

Maybe if you sit close enough… although integration would be a problem for many multi-ways.

Most people likely aren’t too concerned about the level of “accuracy” you and I care about.

Room treatment here at ASR is often viewed as completely optional. And in a sense it is… where to an extent we can hear through the noise — and EQ can help, too, as well. But it really does not “fix” the root of the problem. One needs to acknowledge the room’s transfer function is in a sense always being convolved with any speaker’s own “pristine” anechoic response.
 

dasdoing

Major Contributor
Joined
May 20, 2020
Messages
4,301
Likes
2,772
Location
Salvador-Bahia-Brasil
Maybe if you sit close enough… although integration would be a problem for many multi-ways.

Most people likely aren’t too concerned about the level of “accuracy” you and I care about.

Room treatment here at ASR is often viewed as completely optional. And in a sense it is… where to an extent we can hear through the noise — and EQ can help, too, as well. But it really does not “fix” the root of the problem. One needs to acknowledge the room’s transfer function is in a sense always being convolved with any speaker’s own “pristine” anechoic response.

I think the transient accuracy is something we are used to not beeing there....we don't miss what we never heard. So yea, it's optional. But we have to realize this is something that will always stay between us and (quase)realistic reproduction.
 

DaveBoswell

Member
Joined
Dec 15, 2022
Messages
29
Likes
25
Location
Toronto, Canada
Interesting thread but not quite sure what the final conclusion is, but reminds me of a question that I had for some time that I have not seen an answer to in other posts or the REW documentation from a recent re-read:

@JohnPM Given that the peak sound pressure at a given frequency can vary in magnitude during the window of time as defined in the IR Window dialog (which defaults to 500ms if I am not mistaken) resulting from room response, SBIR, comb filtering, etc,, what does the SPL Magnitude plotted on the Frequency Response actually represent for a given frequency? i.e does it represent the RMS/average of all the SPL in the IR window, the SPL from the total energy in the window, the highest peak SPL at any point in the window, or something else?

Thanks!
 
Top Bottom