OP
- Thread Starter
- #141
It is called job security Sal.I think you just enjoy the schitt out of confusing us unwashed masses.LOL

It is called job security Sal.I think you just enjoy the schitt out of confusing us unwashed masses.
I've the reverse opinion. I agree with AP. If we're doing linearity then do that. We know the noise floor will interfere even if the chip puts out a signal amongst the noise of the proper level.Correct. It is the main point I made to AP. That you can't exclude what is actually in the signal the user gets in linearity measurements. Noise and distortion should be included to the extent it doesn't screw up the analyzer too badly.
Two issues:I've the reverse opinion. I agree with AP. If we're doing linearity then do that. We know the noise floor will interfere even if the chip puts out a signal amongst the noise of the proper level.
Couldn't a DAC with a negative error at low levels have that balanced by noise as you go lower to get a nice looking linearity plot. Admittedly not likely. Most of the time at lower levels you are measuring a noise issue more than linearity. The same reason I don't think much of the -90db sine wave. Pretty much look at the noise floor and you'll know how that is going to look.Two issues:
1. You are measuring what we don't hear. We hear the total signal.
2. There are devices that nail the response to the level we are measuring.
Linearity is the ultimate test of a DAC: that it has a straight line transfer function between input digital samples and output analog. That output analog must be definition include all contributions including noise and distortion.
Checking just the level after removing all noise and distortion is an academic exercise devoid of real world value.
Repeatability would suffer in that case. That was indeed part of the analysis I went through to develop the pre-filter. As I noted, there is some 50 dB of noise reduction going on outside of the 200 Hz tone.Couldn't a DAC with a negative error at low levels have that balanced by noise as you go lower to get a nice looking linearity plot.
Repeatability would suffer in that case. That was indeed part of the analysis I went through to develop the pre-filter. As I noted, there is some 50 dB of noise reduction going on outside of the 200 Hz tone.
Let's re-look at the time domain waveform and this time, let's forget about the Topping D50 and only pay attention to stereo output of the DAC3 on the right:
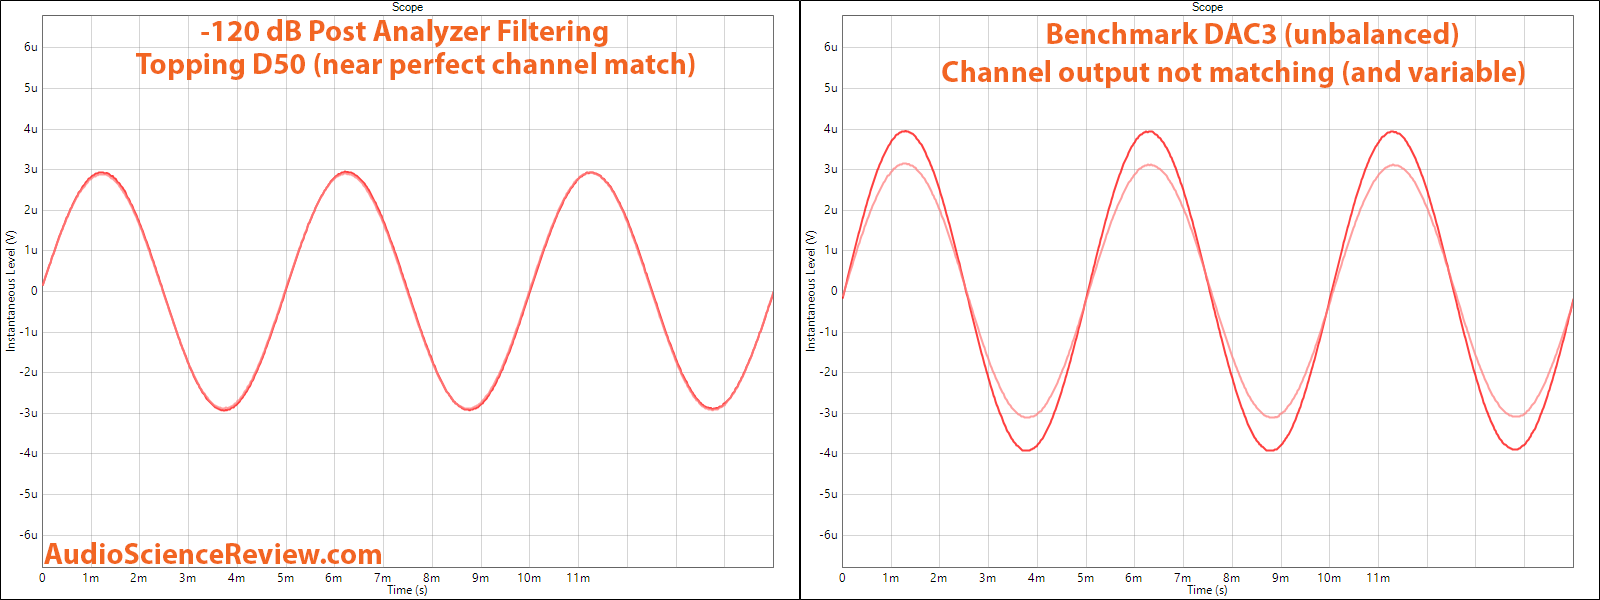
As you see, the amplitude in one channel is lower than the other. So regardless of what is being measured, one channel output must be in error. And that tracks in linearity measurement:
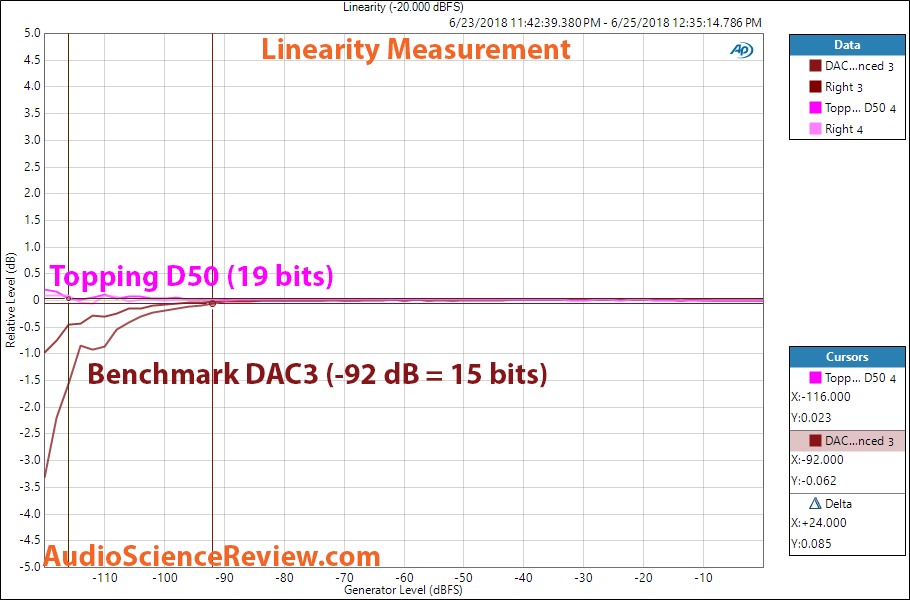
See how one channel has much more error than the other.
The differential is not in noise level as the two sine waves (post the high-q filter) look pretty clean.
BTW, thanks for the questioning. I want us to discuss this and arrived some kind of consensus on what is going on.
an academic exercise devoid of real world value.
I would love to see measurements of some audiophile darlings... Things like MSB or dCS.
Like...
<snip>
JA has measured some of those.
I don't quite understand how we can put a point on the linearity graph at low levels if we don't filter out the noise, noise is random, are you just capturing a momentary voltage at arbitrary time and call it a day? Well, it's got to be a/c, so you are averaging over X number of periods or something along these lines?
You held the key to the issue Thomas and you just didn't know it!!!Can’t we provide both , the clean ( academic) value and the ‘real world ‘ value or is that too much work?
In this case, there is no difference. One channel is worse than the other so that alone indicates accuracy error at these low levels.Good point. There is actually a "settling algorithm" behind the scenes in Audio Precision software. Indeed I have had to optimize this to get stable values at very low measured levels. It has choice of averaging or attempting to arrive at minimal error using multiple measurement point. There is also settling time to make sure everything becomes stable before being measured after a parameter change.I don't quite understand how we can put a point on the linearity graph at low levels if we don't filter out the noise, noise is random, are you just capturing a momentary voltage at arbitrary time and call it a day? Well, it's got to be a/c, so you are averaging over X number of periods or something along these lines?
FYI I created Jude's/AP's setting for this latest analysis and there is no practical difference. Here is my method and theirs overlayed on top of each other:Now multi-bit DACs have issues with that and such a test is likely very good. Probably a sensible test for the Yggy in addition to Amir's method. Which sounds like where AP, Jude and Amir disagree somewhat.