• WANTED: Happy members who like to discuss audio and other topics related to our interest. Desire to learn and share knowledge of science required. There are many reviews of audio hardware and expert members to help answer your questions. Click here to have your audio equipment measured for free!

Preferred Target FR Curve

OCA

Addicted to Fun and Learning
Forum Donor
Joined
Feb 2, 2020
Messages
679
Likes
506
Location
Germany
I think it's fair to say that a preferred target curve should be pronounced with a preferred dB level as well as number of frequency dependent windowing cycles and type of smoothing applied to the response to reach that target.

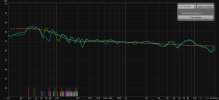
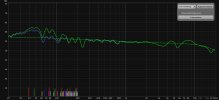
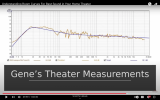
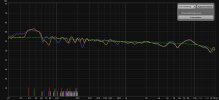
Below REW plots are all from the same speaker responses for different fdw & smoothing parameters and different target curves. All targets and their levels are auto calculated from the default response. Interestingly, they only agree on the frequency magnitude at around 600Hz. REW will only change calculated target level by the fdw applied, type of smoothing used will not have an effect.

It can be seen quite clearly that the magnitude of correction required changes vastly depending on these factors alone. I use Mitch's fixed slope (0.7) target curve which I carefully deciphered from his video (and I believe that video is the bible of digital room correction) for around 75dB measurements and I am (along with many others) quite satisfied with its results. But for low volume night listening for example, I will need to boost the bass a bit. Almost all of us have a peak and dip in the lowbass region due to room modes. The dip will not disappear with any kind of correction. With songs that have bass around that frequency, you will feel your bass response is too low. If the bass frequency used is lower around your first peak, you'll feel bass is too strong. Additionally, there's the "trained vs untrained" ear dilemma which varies massively in the bass region in my experience with people's choices and I will not even go into that.

So, there's no one size fits all target response and apparently it's not even that important compared to so many other things you can get wrong in DRC IMHO.

Target Curves.jpg
 
Last edited:

fineMen

Major Contributor
Joined
Oct 31, 2021
Messages
1,504
Likes
680
... what's your preferred FR Curve and EQ goals when using DSP?
I easily get used to more or less tilt towards the treble in the reverberation field. The direct sound should be just plain flat.

But let me ask back, why would you change your actually preferred state of affairs to something else?! DIRAC for that matter corrects in room response, or the direct sound?
 

thewas

Master Contributor
Forum Donor
Joined
Jan 15, 2020
Messages
6,904
Likes
16,937
My preference in the last months is flat MMM based response around the listeners position below 500 Hz and flat anechoic listening window response above 500 Hz, here for my classic stereo system

1678974923283.png


and here for my desktop listening system

1678975003633.png
 

Le Concombre

Active Member
Joined
Jul 8, 2020
Messages
120
Likes
34
Sure SPL matters and not only because of Fletcher Munson. I think FR target has to be adapted to the room and the speakers and if you calibrate, as I do, to Katz's method so that Pink_Noise 500-2K -20 dBFS RMS reads 83 dB (A, C, the same with those frequencies) and play his honor roll selection at Katz's determined volumes you don't want to push low too high if you don't have a mega sub.

For the attached iterations :

I corrected to MMM results of PN played with VBA filters made after OCA with the Xcel he provides below his tuto I linked earlier : limits dips and peaks as far as correcting the MMM ss is concerned. PLUS it will dynamically "in shifted real time" cancel the standing waves.

I aimed at getting roughly in the right ball park in 2 shots, with an about 80 Hz anchored 4 octaves boost and a slightly below 600 about 1 octave cut to correct the overshoot. The rest is minor. I see no point in correcting the peaks FURTHER than what VBA does below 60.

A matches Toole's, even when considering the below 64 bump since it's free taste zone per Toole's indication.

The B set exploits a # 89 peak I correct less + few tweaks to match Harman Target Curve

no more than 10 Pk points, no Q>10, especially over 200 ; no Pk point over 596 Hz

But for a 8560 O.67 -2.7 dB optional Pk that brings A close to B&K and B to Harman Audio Test System. Implemented in 2 different sets : A+ & B+ (4 convo sets total). Truth is it's more tailored after Steve Hoffman suggestion's of a -3 dB/ "1" on his mastering tool (Q 0.67 as far as I could dig) @ 8K for taming hot mastering : option for issues.

I always go first to A or B ; typically A for classical and B, well, you guess.

In HQP I put, for L and R lines, that is 1&2, the REW Pk correction as txt in Pipeline setup and add, on the same lines, the VBA filters that are .wav cf OCA

PS : teasing for those who haven't watched the Audioholics video I linked, here are the FR they show.
 

Attachments

  • LR B VS HTC ONE SIXTH.jpg
    LR B VS HTC ONE SIXTH.jpg
    195 KB · Views: 62
  • LR A ONE SIXTH.jpg
    LR A ONE SIXTH.jpg
    193.2 KB · Views: 47
  • A VS B RIGHT.jpg
    A VS B RIGHT.jpg
    191.2 KB · Views: 57
  • Capture d’écran 2023-03-16 à 09.01.11.png
    Capture d’écran 2023-03-16 à 09.01.11.png
    466.1 KB · Views: 62
  • Capture d’écran 2023-03-16 à 08.58.45.png
    Capture d’écran 2023-03-16 à 08.58.45.png
    523.7 KB · Views: 73
Last edited:
  • Like
Reactions: OCA

fineMen

Major Contributor
Joined
Oct 31, 2021
Messages
1,504
Likes
680
1679685365850.png

Watch the scale!
Mono, left at seating position
Red: time window 5ms
Green: time window 50ms
Blue: time window 50ms with fill-up driver, mono with added delay of 5ms

Fill-up driver equalizes the waveguide's directivity, eases listening outside of stereo triangle
 

OCA

Addicted to Fun and Learning
Forum Donor
Joined
Feb 2, 2020
Messages
679
Likes
506
Location
Germany
Sure SPL matters and not only because of Fletcher Munson. I think FR target has to be adapted to the room and the speakers and if you calibrate, as I do, to Katz's method so that Pink_Noise 500-2K -20 dBFS RMS reads 83 dB (A, C, the same with those frequencies) and play his honor roll selection at Katz's determined volumes you don't want to push low too high if you don't have a mega sub.

For the attached iterations :

I corrected to MMM results of PN played with VBA filters made after OCA with the Xcel he provides below his tuto I linked earlier : limits dips and peaks as far as correcting the MMM ss is concerned. PLUS it will dynamically "in shifted real time" cancel the standing waves.

I aimed at getting roughly in the right ball park in 2 shots, with an about 80 Hz anchored 4 octaves boost and a slightly below 600 about 1 octave cut to correct the overshoot. The rest is minor. I see no point in correcting the peaks FURTHER than what VBA does below 60.

A matches Toole's, even when considering the below 64 bump since it's free taste zone per Toole's indication.

The B set exploits a # 89 peak I correct less + few tweaks to match Harman Target Curve

no more than 10 Pk points, no Q>10, especially over 200 ; no Pk point over 596 Hz

But for a 8560 O.67 -2.7 dB optional Pk that brings A close to B&K and B to Harman Audio Test System. Implemented in 2 different sets : A+ & B+ (4 convo sets total). Truth is it's more tailored after Steve Hoffman suggestion's of a -3 dB/ "1" on his mastering tool (Q 0.67 as far as I could dig) @ 8K for taming hot mastering : option for issues.

I always go first to A or B ; typically A for classical and B, well, you guess.

In HQP I put, for L and R lines, that is 1&2, the REW Pk correction as txt in Pipeline setup and add, on the same lines, the VBA filters that are .wav cf OCA

PS : teasing for those who haven't watched the Audioholics video I linked, here are the FR they show.
I finally figured how to include all 3 room dimensions in the VBA filter and align low pass impulse peak precisely. Just uploaded this new video explaining it:

 
Last edited:

ernestcarl

Major Contributor
Joined
Sep 4, 2019
Messages
3,113
Likes
2,330
Location
Canada
I finally figured how to include all 3 room dimensions in the VBA filter and align low pass impulse peak precisely. Just uploaded this new video explaining it:


Just to be clear, you aren't really "cancelling out" the standing waves of your room with this method, but rather merely applying compensating filters. If the peaks and dips you see in the measurements miraculously appear with such a regular pattern, then this can work fine. However -- same rules applies -- there is going to be some loss in headroom, and so, smaller, more limited speakers will not be able to play as dynamically loud as before at higher volumes without consequence.
 

OCA

Addicted to Fun and Learning
Forum Donor
Joined
Feb 2, 2020
Messages
679
Likes
506
Location
Germany
Thanks for your contribution and valuable comments. I see where you're coming from and I didn't have an opportunity to test it with small speakers. I don't know if anyone who liked the results of VBA ever did. But the "time delayed Dirac pulse" is designed to cancel out the standing waves which will have a regular pattern in every room as it's merely a function of room dimensions. Again I agree, in reality it's never that easy or straightforward to accurately calculate the resonant frequency and some dips and peaks especially later in the frequency band could be a hit and miss. But its clean effect in the first dip/peak/dip trio is not achievable with any kind of spontaneous filter.

Without digressing too much from the forum subject, I have to emphasize that VBA is very different to a set of IIR filters targeting a similar FR below the transient and the step responses of the two such filters speak for themselves:

1679818849058.png


I would like to hear your comments after you try it.
 

ernestcarl

Major Contributor
Joined
Sep 4, 2019
Messages
3,113
Likes
2,330
Location
Canada
Okay, maybe I’m missing something crucial here, but the final end result I’ve seen was no more better than what I got with the simple mixed phase FIR filter I created and already uploaded prior.

Wavelet spectrograms:
1679852566547.png 1679852581665.png 1679852589000.png

First and last plots are the original unequalized response and EQ filtered response, respectively. I do not see any significant "cancelling".
 

Attachments

  • cancelling.mdat.zip
    1.7 MB · Views: 37
Last edited:

OCA

Addicted to Fun and Learning
Forum Donor
Joined
Feb 2, 2020
Messages
679
Likes
506
Location
Germany
Okay, maybe I’m missing something crucial here, but the final end result I’ve seen was no more better than what I got with the simple mixed phase FIR filter I created and already uploaded prior.

Wavelet spectrograms:
View attachment 274940 View attachment 274941 View attachment 274942

First and last plots are the original unequalized response and EQ filtered response, respectively. I do not see any significant "cancelling".
The VBA wavelet still looks a bit better IMO (excluding around 25ms GD VBA introduces throughout due to the delayed impulse) but the FIR filters probably aren't boosting any dips. The difference of VBA is that it fixes for the dips and extends the bass down the frequency band as well. The result is an overall deeper bass response.

Dirac ART is basically working with the same principle, only uses another speaker to send the counteracting sound wave.

I attached my own mdat with the new version of VBA if you want to compare.
 

Attachments

  • VBA.zip
    4.3 MB · Views: 39
Last edited:

ernestcarl

Major Contributor
Joined
Sep 4, 2019
Messages
3,113
Likes
2,330
Location
Canada
The VBA wavelet still looks a bit better IMO (excluding around 25ms GD VBA introduces throughout due to the delayed impulse) but the FIR filters probably aren't boosting any dips. The difference of VBA is that it fixes for the dips and extends the bass down the frequency band as well. The result is an overall deeper bass response.

Dirac ART is basically working with the same principle, only uses another speaker to send the counteracting sound wave.

I attached my own mdat with the new version of VBA if you want to compare.

Thank you. This is what I wanted to see. I see more clearly how the delayed IR correction looks... But I cannot really agree with you how you choose to describe filter as "fixing" for the dips when it only really partially compensates -- and, honestly, still isn't all that effective. Nope, this really is not doing the same thing as Dirac ART.

FDW 20 cycles
1679874099468.png

Seems to have "slimmed or compressed down" maximum phase peak occuring at 40 ms -- but not realistically all that much.

1679874120318.png


40 dB scale
1679893042215.png 1679893048964.png

25 dB scale
L - no EQ.png L - VBA filter.png L - VBA filter + excess phase linearizing filter.png L - Extracted Minimum Phase Version.png
*No realistic DSP EQ (only by itself) can get you close enough to the idealized minimum phase version (last graph). But active and/or passive acoustic treatment -- and acoustically optimized positioning with added sub(s) -- will get you close...
 

Attachments

  • actual VBA filter vs Idealized MP version.mdat.zip
    1 MB · Views: 38
Last edited:

OCA

Addicted to Fun and Learning
Forum Donor
Joined
Feb 2, 2020
Messages
679
Likes
506
Location
Germany
Thank you. This is what I wanted to see. I see more clearly how the delayed IR correction looks... But I cannot really agree with you how you choose to describe filter as "fixing" for the dips when it only really partially compensates -- and, honestly, still isn't all that effective. Nope, this really is not doing the same thing as Dirac ART.
I don't think Dirac will ever go into the details of how ART exactly works for their own sake but from what I've read so far, a surround speaker must be bursting a polarity inverted pulse exactly when the front speaker pulse reaches that surround speaker. Peak is diminished even before it reaches and bounces back from the rear wall. The principle is the same. Obviously, it'll not suffer even half as much group delay as the distance will be significantly shortened. I've also seen ART'S waterfall graphs. It works nicely but it's not "all that effective" either ;)
 

ernestcarl

Major Contributor
Joined
Sep 4, 2019
Messages
3,113
Likes
2,330
Location
Canada
I don't think Dirac will ever go into the details of how ART exactly works for their own sake but from what I've read so far, a surround speaker must be bursting a polarity inverted pulse exactly when the front speaker pulse reaches that surround speaker. Peak is diminished even before it reaches and bounces back from the rear wall. The principle is the same. Obviously, it'll not suffer even half as much group delay as the distance will be significantly shortened. I've also seen ART'S waterfall graphs. It works nicely but it's not "all that effective" either ;)

Hmmmn... I have my own doubts that's it's going to be much better than what Trinnov's new large scale sub array system can do:

1679871374726.png 1679871386606.png active passive tx uniform.png active passive tx sub-optimal.png

Transient response "uniformity" is the key word here. That's what I would like to see.


Last edited:
  • Like
Reactions: OCA

dingdong3

Member
Joined
Nov 29, 2022
Messages
12
Likes
2
It's a pretty interesting idea. It's easy to see if it actually helps with the cancellation of the standing wave.
Try to MMM(Moving Mic Messurement).
The response before applying the filter can also be measured with MMM, measured to make the filter, applied it, and verified with MMM again.
The arithmetic function of A*B REW is quite accurate, but I think this is a matter of time after all and about controlling the energy that exists in the room.
I would appreciate it if the person who applied or made this filter could verify it through MMM measurement.
 

ernestcarl

Major Contributor
Joined
Sep 4, 2019
Messages
3,113
Likes
2,330
Location
Canada
It's a pretty interesting idea. It's easy to see if it actually helps with the cancellation of the standing wave.
Try to MMM(Moving Mic Messurement).
The response before applying the filter can also be measured with MMM, measured to make the filter, applied it, and verified with MMM again.
The arithmetic function of A*B REW is quite accurate, but I think this is a matter of time after all and about controlling the energy that exists in the room.
I would appreciate it if the person who applied or made this filter could verify it through MMM measurement.

MMM will not clearly show the time “correcting” effect of said filter.
 

dingdong3

Member
Joined
Nov 29, 2022
Messages
12
Likes
2
No. I mean,
That filter uses delay to digitally approach peaks and dips.
If it actually works, we can't see other graphs like Impulse and Step response, but at least you can see the low-band energy, FR, shown in MMM.
Of course, you can cross-verify it through multi-point measurements, but you can't ignore the deviation unless you do it every time at exactly the same location, exactly the same angle, and exactly the same height.
So, as the maker of the filter says, if this actually acts as an energy filler, covering the dip, it's going to be shown in MMM's FR graph.
 

ernestcarl

Major Contributor
Joined
Sep 4, 2019
Messages
3,113
Likes
2,330
Location
Canada
No. I mean,
That filter uses delay to digitally approach peaks and dips.
If it actually works, we can't see other graphs like Impulse and Step response, but at least you can see the low-band energy, FR, shown in MMM.
Of course, you can cross-verify it through multi-point measurements, but you can't ignore the deviation unless you do it every time at exactly the same location, exactly the same angle, and exactly the same height.
So, as the maker of the filter says, if this actually acts as an energy filler, covering the dip, it's going to be shown in MMM's FR graph.

Think about the size of the bass wavelengths here in question in relation to the size of the room/acoustic space. MMM is not going to be significantly more revealing for this purpose.
 

dingdong3

Member
Joined
Nov 29, 2022
Messages
12
Likes
2
Okay...
I don't know about the low extreme low range(10~20hz), but I can judge between 60 and 80hz.
And even if it's not MMM measurement, it should be possible to re-measure it again. I'm not blaming you and the filter maker.I'm actually looking at this thread with interest right now. I'm also interested in this because there must be other measurements to get good reviews from many people.
Just like Inversion, you can rely on the A*B prediction of REW to some extent by simply cutting down the peak, but I think this is a different topic.
The peaks and dips interact with each other (at different locations)
That's why we need data on whether the filter actually fills up energy by applying it and making multiple measurements at different locations (minimum spacing of 60cm).
I can also apply the filter myself, re-verify the measurements, but since I'm out of town now, I'll ask others in this thread to verify them at the same time.
 

OCA

Addicted to Fun and Learning
Forum Donor
Joined
Feb 2, 2020
Messages
679
Likes
506
Location
Germany
Okay...
I don't know about the low extreme low range(10~20hz), but I can judge between 60 and 80hz.
And even if it's not MMM measurement, it should be possible to re-measure it again. I'm not blaming you and the filter maker.I'm actually looking at this thread with interest right now. I'm also interested in this because there must be other measurements to get good reviews from many people.
Just like Inversion, you can rely on the A*B prediction of REW to some extent by simply cutting down the peak, but I think this is a different topic.
The peaks and dips interact with each other (at different locations)
That's why we need data on whether the filter actually fills up energy by applying it and making multiple measurements at different locations (minimum spacing of 60cm).
I can also apply the filter myself, re-verify the measurements, but since I'm out of town now, I'll ask others in this thread to verify them at the same time.
I not only convolute the filter with A*B in REW but also re-measure with the filter convolved and usually continue adding new filters on to the actual measurements rfather than the caculated ones. But in my experience, A*B is accurate to the extent that usually the measurements' accuracy will fall behind it. More often then not, even repeated 1M length measurements (and with above 80dB loudness level) will have small differences here and there. And this is with a Umik-2. I know some of that is related to a 50Hz noise in my AC power but there will be tiny differences elsewhere, too. Lately, I have started to take 4M length repeated measurements (at least 3) and vector average them when I need precision.

With VBA though, there's night and day difference in the bass when you just listen to it so you don't really need accurate measurements to hear its effect. But, back to @ernestcarl 's point, it would be useful to hear the listening experience of people with small speakers.
 

ernestcarl

Major Contributor
Joined
Sep 4, 2019
Messages
3,113
Likes
2,330
Location
Canada
With VBA though, there's night and day difference in the bass when you just listen to it so you don't really need accurate measurements to hear its effect. But, back to @ernestcarl 's point, it would be useful to hear the listening experience of people with small speakers.

Indeed, it is possible that the psychoacoustic effect may be winning over despite of how the convolved (from prior) measurements appear — but I also wonder how much of it really comes from the boosting and added extension of the bass which one can also already manually apply in the more conventional way.

As I do not have a similar setup (my room is already heavily damped above 40Hz, I can’t really test this with my own two ears, only speculate based on the effect I see in those set of measurements.
 
Last edited:
Top Bottom