• WANTED: Happy members who like to discuss audio and other topics related to our interest. Desire to learn and share knowledge of science required. There are many reviews of audio hardware and expert members to help answer your questions. Click here to have your audio equipment measured for free!

Preferred Target FR Curve

Le Concombre

Active Member
Joined
Jul 8, 2020
Messages
120
Likes
34
Frequency dependent windowing discards the later arriving energy that goes beyond the number of cycles chosen. In a very dry room like mine, I do not see huge changes in the response. If a lot of the sound going into the mic comes much later in time or are reflected energy, it will be removed. Vector averaging at widely spaced measurements in a room where there's a lot of reflections/time difference in arrivals also causes cancellations or loss of energy -- kind of like a comb filtering energy loss which may be more pronounced the higher up in frequency you go -- but this does not necessarily mean you aren't hearing those filtered out late arrivals -- much of it is just spaced or spread out further away from the initial transient attack. For EQing the magnitude respone, RMS averaging is normally used... unless you require/want the time/phase information. Also, prior to vector averaging measurements from the same channel/speaker, make sure that the phases or IRs are aligned.

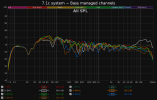
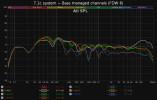
When FDW is applied to the rears (which are very distantly positioned) of my 7.1c setup, I see a bigger reduction in magnitude compared to the fronts and sides which are at a very nearfield distance. Because of the reflections, however, they sound much louder than what the steady state curves indicate. This is why when setting up the levels and broad peak PEQs/shelving, I also use my own ears and do not just rely on how the curves look on the graphs.
THANK you but let me rephrase my question : it's not about the relative benefits of using FDW or non FDW but about a glitch I can't put my finger on that causes MY measurements to change slope in HF when I apply FDW to them while on the imported mdat of OCA it does not

BUT maybe your answer is spot on : it would not be a glitch or a setting issue but a particularity of my room (small while my speakers are big ; acquired them when I had a much bigger listening room...)

I agree with you that EQing should be done on the magnitude response, RMS averaging. But in the case of OCA, FDW keeps the general shape of the response, jus simplifies peaks and dips, so it should yield the same eQ values while he keeps time/phase information.
 
Last edited:

ernestcarl

Major Contributor
Joined
Sep 4, 2019
Messages
3,113
Likes
2,330
Location
Canada
it would not be a glitch or a setting issue but a particularity of my room

Yes, though most likely it's a combination of the room acoustics and directivity of your own speakers that is causing the apparent discrepancy in what you are seeing. I've seen something similar where someone's HF response just took a huge nose dive right after FDW was applied. A graphic of your measurements may be helpful to convey the severity of this discrepancy, perhaps?

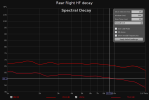
Blue and brown show my previously mentioned rear speakers:
1677708161085.png 1677708171007.png
*Slope doesn't change too much, as you say, but the overall level does. Another interesting tidbit: the white curve's HF sound is characteristically the most dull and muted or subdued of all the speakers in this set. Yet again, FR curves can deceive.


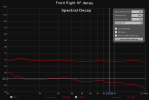
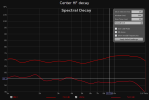
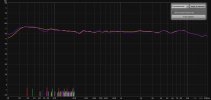
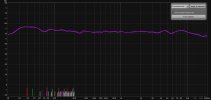
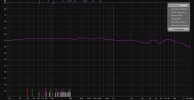
**Closer look at what's really going on:

Spectral decay
1677784651167.png 1677784664815.png 1677784673031.png
Full frequency response curve ~vs~ "Late" FR curve (20 ms trace)


---


And here's that "someone" else's room and speaker measurements I saw where we see a big difference:

1677759855532.png
 
Last edited:

Le Concombre

Active Member
Joined
Jul 8, 2020
Messages
120
Likes
34
thank you for your explanations and, you're right, there's more to the picture than FR
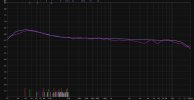
here's my latest iteration with VBA and as shown on L channel it's pretty close to Harman 4.
Nevertheless it's drastically better with VBA since standing waves are dynamically, continuously, cancelled : both more relaxed and snappier sound, jet black backrounds from which the music emerge etc
 

Attachments

  • LEFTs.jpg
    LEFTs.jpg
    208 KB · Views: 60
  • H4 VBA BOTH.jpg
    H4 VBA BOTH.jpg
    206.5 KB · Views: 60

ernestcarl

Major Contributor
Joined
Sep 4, 2019
Messages
3,113
Likes
2,330
Location
Canada
thank you for your explanations and, you're right, there's more to the picture than FR
here's my latest iteration with VBA and as shown on L channel it's pretty close to Harman 4.

The VBA trick is interesting, but I've not found a need for it yet in any of my setups....

Nevertheless it's drastically better with VBA since standing waves are dynamically, continuously, cancelled : both more relaxed and snappier sound, jet black backrounds from which the music emerge etc

Certainly, it would be interesting as well to see more detailed and clear illustrations of this working vs your "best" previous alternative EQ for comparison. I can't really tell how much of an improvement occurred objectively thereafter just by your own description, though. But if you're happy with the result in what you hear, that's all that really matters anyway.
 

Le Concombre

Active Member
Joined
Jul 8, 2020
Messages
120
Likes
34
The VBA trick is interesting, but I've not found a need for it yet in any of my setups....


Certainly, it would be interesting as well to see more detailed and clear illustrations of this working vs your "best" previous alternative EQ for comparison. I can't really tell how much of an improvement occurred objectively thereafter just by your own description, though. But if you're happy with the result in what you hear, that's all that really matters anyway.
The "LEFTs" picture above shows no significant difference, as far as as steady state measurement can show, with my ""best" previous alternative EQ" ; yet the difference in perceived SQ is night and day.

it's up to you or anybody else to try or not.
 

Le Concombre

Active Member
Joined
Jul 8, 2020
Messages
120
Likes
34
I liked this video :

I confirm the VBA is a game changer IMO, well worth the effort.

At the moment I have a whole bunch of convolution sets to play with (none is 100 % perfect with 100 % of recordings, if ever), made after :
H4
HC2
HTC
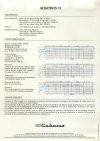
And, last but not least, a bunch made over a flat target ( but please note that I apply no correction above 600 Hz and certainly would not mess with the steady state irregularities above 3K) to which I add 2 octaves (0.67 Q) increments @ 47 Hz (whatever naturally peaks in that region) of :

0
2 (resembling Toole)
4(Trained Listener region)
5
6 ( quite HC2 like, see picture)
7 (quite max IMO )
8

beyond having a kind of bass volume control, the key point is to match approach different targets envelopes with a single broad ( 2 octaves !) control while idiosyncrasies of one's room are taken care of once, and with the easiest target, flat. Plus the behaviour of my woofers is better respected with a FR matching anechoic measurements (no excess boost below 35)
 

Attachments

  • FLAT RIGHT.jpg
    FLAT RIGHT.jpg
    224.9 KB · Views: 74
  • albatros_6-4.jpg
    albatros_6-4.jpg
    181.7 KB · Views: 76
  • 6 VS HC2.jpg
    6 VS HC2.jpg
    223.3 KB · Views: 85
Last edited:

ernestcarl

Major Contributor
Joined
Sep 4, 2019
Messages
3,113
Likes
2,330
Location
Canada
I’m afraid I’ve lost track. Why not simply post the mdat file: a single channel uncorrected, same but corrected, target curve, and a copy for of your preferred convolution correction filter for that channel.
 

Le Concombre

Active Member
Joined
Jul 8, 2020
Messages
120
Likes
34
I’m afraid I’ve lost track. Why not simply post the mdat file: a single channel uncorrected, same but corrected, target curve, and a copy for of your preferred convolution correction filter for that channel.
what's the point ?

I reaction to the thread's title, "Preferred FR target curve", I share 2 findings/conclusions :

SQ might be much different, even if FRs at steady state look alike, if the standing waves are dynamically cancelled by a VBA

rather than a target, let your speakers breathe without correction above the frequency where room influence vanishes (roughly twice Schroeder in my case), and use a broad bass control over a base where idiosyncrasies are solved.

you may also play with OCA's VBA in his provided mdat but the timing of the impulse and the frequency for the crossover construction should result of your own use of the Excel file provided by OCA
 

fpitas

Master Contributor
Forum Donor
Joined
Jul 7, 2022
Messages
9,885
Likes
14,213
Location
Northern Virginia, USA
Even using FDW, I find a need to absorb floor bounce to get accurate results.

thumbnail_20220423_074358.jpg


That owl gobbles up stray sounds. Especially if they squeak ;)
 

ernestcarl

Major Contributor
Joined
Sep 4, 2019
Messages
3,113
Likes
2,330
Location
Canada
@Le Concombre

I find your testimony and Serkan’s example somewhat interesting, but not particularly compelling or revolutionary. You talk about night and day differences, yet it’s not obviously clear in your steady state curve images what has exactly happened — a single uncorrected channel measurement and it’s accompanying correction filter should be enough to pique my interest — maybe. I’m not saying you are wrong in your assessment of what sounds/looks better to you.

As I said, none of my setups require the kind of amount of EQ steps shown in those video tutorials.
 

jcr159

Member
Joined
Apr 8, 2021
Messages
21
Likes
15
The title of this thread had me intrigued, but the fact that no one has mentioned their preference relative to playback level tells me there isn't likely much to learn here. It's well understood that via curves of equal loudness, the preference will change for most users, especially in the bass frequencies.

Even though everyone discussing results in different rooms with different room treatment plans, I thought this could be an interesting set of observation data....
 
  • Like
Reactions: OCA

fpitas

Master Contributor
Forum Donor
Joined
Jul 7, 2022
Messages
9,885
Likes
14,213
Location
Northern Virginia, USA
The title of this thread had me intrigued, but the fact that no one has mentioned their preference relative to playback level tells me there isn't likely much to learn here. It's well understood that via curves of equal loudness, the preference will change for most users, especially in the bass frequencies.

Even though everyone discussing results in different rooms with different room treatment plans, I thought this could be an interesting set of observation data....
Honestly, once I get things adjusted right for me, the level isn't too important.

And, you'll want different levels of bass and treble than I do, most likely. The idea behind this thread is kind of like asking how much salt to put on your food.
 

jcr159

Member
Joined
Apr 8, 2021
Messages
21
Likes
15
Honestly, once I get things adjusted right for me, the level isn't too important.

And, you'll want different levels of bass and treble than I do, most likely. The idea behind this thread is kind of like asking how much salt to put on your food.
then you are doing something wrong...

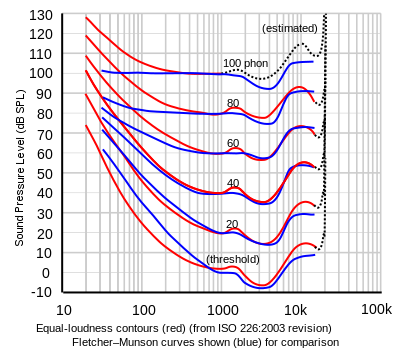
If i change playback level 5 dB, the relative amount of bass needs adjusted if i'm not compensating via curves of equal loudness (which Audessy does for me with Dynamic EQ well enough that I use that option).

Just pointing out there are a lot more variables here than anyone is talking about which makes all the information posted sorta pointless.

for example, if i knew the curve someone posted was what they dialed in when listening, and they don't use any type of dynamic eq profile to apply curves of equal loudness, but they listen at 85 dB average, then I'd know that at that playback level, a flat curve would have every frequency sound equally loud (roughly).

If someone says they listen at an average 70 dB playback level, but don't use dynamic eq, and have a 10 dB "boost" around 100 Hz, then I know that isn't a house curve, they are essentially preferring a "flat" playback and are just applying roughly the equivalent of a Fletcher Munson curve compensation...
400px-Lindos4.svg.png

 
  • Like
Reactions: OCA

fpitas

Master Contributor
Forum Donor
Joined
Jul 7, 2022
Messages
9,885
Likes
14,213
Location
Northern Virginia, USA
then you are doing something wrong...

If i change playback level 5 dB, the relative amount of bass needs adjusted if i'm not compensating via curves of equal loudness (which Audessy does for me with Dynamic EQ well enough that I use that option).

Just pointing out there are a lot more variables here than anyone is talking about which makes all the information posted sorta pointless.

for example, if i knew the curve someone posted was what they dialed in when listening, and they don't use any type of dynamic eq profile to apply curves of equal loudness, but they listen at 85 dB average, then I'd know that at that playback level, a flat curve would have every frequency sound equally loud (roughly).

If someone says they listen at an average 70 dB playback level, but don't use dynamic eq, and have a 10 dB "boost" around 100 Hz, then I know that isn't a house curve, they are essentially preferring a "flat" playback and are just applying roughly the equivalent of a Fletcher Munson curve compensation...
400px-Lindos4.svg.png

Thank you, but I'm not doing anything wrong. It's called preference. I know about equal loudness curves.
 

ernestcarl

Major Contributor
Joined
Sep 4, 2019
Messages
3,113
Likes
2,330
Location
Canada
then you are doing something wrong...

You presume too much. Loudness compensation EQ is an option and not an absolute requirement for listening. While I use software loudness compensation DSP myself (not all the time), there are a lot of people who simply prefer not to use it — and, no, they’re not necessarily ignorant of said tech feature.
 

Sokel

Master Contributor
Joined
Sep 8, 2021
Messages
6,161
Likes
6,261
The title of this thread had me intrigued, but the fact that no one has mentioned their preference relative to playback level tells me there isn't likely much to learn here. It's well understood that via curves of equal loudness, the preference will change for most users, especially in the bass frequencies.

Even though everyone discussing results in different rooms with different room treatment plans, I thought this could be an interesting set of observation data....
 

fpitas

Master Contributor
Forum Donor
Joined
Jul 7, 2022
Messages
9,885
Likes
14,213
Location
Northern Virginia, USA
You presume too much. Loudness compensation EQ is an option and not an absolute requirement for listening. While I use software loudness compensation DSP myself (not all the time), there are a lot of people who simply prefer not to use it — and, no, they’re not necessarily ignorant of said tech feature.
Even back in the Loudness Button days I usually avoided it.
 

jcr159

Member
Joined
Apr 8, 2021
Messages
21
Likes
15
You presume too much. Loudness compensation EQ is an option and not an absolute requirement for listening. While I use software loudness compensation DSP myself (not all the time), there are a lot of people who simply prefer not to use it — and, no, they’re not necessarily ignorant of said tech feature.

I don't think my post assumed anyone was using or not using dynamic volume features. I tried to point out that regardless, it is important to understand the playback levels, and whether dynamic volume features are in use when posting a "preference curve", otherwise the curve is essentially pointless because the reader can't interpret what that means to the system output in the users room.
 

ernestcarl

Major Contributor
Joined
Sep 4, 2019
Messages
3,113
Likes
2,330
Location
Canada
I don't think my post assumed anyone was using or not using dynamic volume features. I tried to point out that regardless, it is important to understand the playback levels, and whether dynamic volume features are in use when posting a "preference curve", otherwise the curve is essentially pointless because the reader can't interpret what that means to the system output in the users room.
I get that… Well, there are already other threads which cover this issue amongst others — stuff that can influence room curves (e.g. room RT and decay, distance, listening angles) if you search for the keyword “target curve”. My participation here was only tangential… However, rather than telling people it’s all pointless, why not just share/post your preferred target curve and at the what reference listening volume. Supply more details like you use this or that DSP if you think it will help explain further your own choices.
 

fpitas

Master Contributor
Forum Donor
Joined
Jul 7, 2022
Messages
9,885
Likes
14,213
Location
Northern Virginia, USA
I just dropped in to mention floor bounce. And to post the measurement owl ;)
 
Top Bottom