There should be a separate section for schiit in brown.

-
WANTED: Happy members who like to discuss audio and other topics related to our interest. Desire to learn and share knowledge of science required. There are many reviews of audio hardware and expert members to help answer your questions. Click here to have your audio equipment measured for free!
You are using an out of date browser. It may not display this or other websites correctly.
You should upgrade or use an alternative browser.
You should upgrade or use an alternative browser.
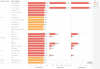
How do you like this SINAD Chart Style?
- Thread starter amirm
- Start date
Thanks. That looks good. Question is, who will volunteer to create and maintain it.")
Having it in Google Docs would be optimal. It would be fantastic to be able to use checkboxes to select features you need, and then be able to see all the DAC's that have been tested. Then have links to the reviews etc. I would gladly help out updating the spreadsheet.
- Joined
- Nov 6, 2018
- Messages
- 170
- Likes
- 182
That kind of thing can be worked in pretty easily; the labor-intensive part is collecting the data. (Thank you, @amirm !)What would really make this compelling is another chart that graphs cost (MSRP or retail) per SINAD (value). Also I think it would be worthwhile to add a "redline" below which you consider the performance below acceptable vs above the line where price and/or reaching pinnacle performance becomes the most desirable traits.
Finally, I think it might be worthwhile to add another color to the chart to show units that might be otherwise undesirable even with good/great SINAD measures. e.g. Excessively high headphone output impedance (where applicable)
Rodney
Attachments
- Joined
- Nov 29, 2017
- Messages
- 543
- Likes
- 1,618
SINAD is only dominated by noise at low signal levels. At full-scale distortion should dominate so IMO SINAD is fine for the chart.
.
I went through the top few units Amir has measured to check this one - it's a bit of a tossup to my eye, with stuff like the Vega, UDP205, and Qutest apparently being noise dominated to my math, whereas the SMSL D1, Benchmark DAC3, and a few others are dominated by the harmonics' contribution, so it's more of a mixed bag than I'd been eyeballing it at. I think that comparing, for example, the strangely-named DAC DAC HS with, for example, Apogee's Groove gets at what I'm griping about here, however. I'd rather be able to make apples-to-apples comparison of both distortion and noise performance rather than rolling them into a single score.
OP
- Thread Starter
- #66
I had randomly picked the colors for testing. Here it is now with latest suggestions:

That's quite nice. Easy to see. I especially like the color coding. Only thing is on my monitor the white numbers are a bit hard to see due to their size and color. But I can still read it.I had randomly picked the colors for testing. Here it is now with latest suggestions:
View attachment 21589
OP
- Thread Starter
- #68
Yes, I have that in black in the final version. The one I am working on is on my laptop and doesn't have all the formatting.
I went through the top few units Amir has measured to check this one - it's a bit of a tossup to my eye, with stuff like the Vega, UDP205, and Qutest apparently being noise dominated to my math, whereas the SMSL D1, Benchmark DAC3, and a few others are dominated by the harmonics' contribution, so it's more of a mixed bag than I'd been eyeballing it at. I think that comparing, for example, the strangely-named DAC DAC HS with, for example, Apogee's Groove gets at what I'm griping about here, however. I'd rather be able to make apples-to-apples comparison of both distortion and noise performance rather than rolling them into a single score.
Which is why people who are interested can use this is a starting point and dig in further. Or not since people shopping for DACs will find good options in the "green" range in this latest graphic which will be cheap, have various features and the end user can have confidence that it is audibly transparent vs. everything else. For DAC fetishists, budding audio scientists and subjectivist audiophiles the debate about what is the best DAC will continue
I had randomly picked the colors for testing. Here it is now with latest suggestions:
Half the names are missing?
OP
- Thread Starter
- #71
Yeh, the font was too big in this sample spreadsheet so excel on its own hid every other one. The final one won't have this issue.Half the names are missing?
- Joined
- Feb 23, 2016
- Messages
- 20,765
- Likes
- 37,617
Yeh, the font was too big in this sample spreadsheet so excel on its own hid every other one. The final one won't have this issue.
I thought it was some kind of blind test. You'd start recording musical samples of all the gear, and we'd have to listen and fill in the blanks by ear.
Sorry. I didn’t mean to hurt your feelings, man. I think we didn’t understand each other.I've read both of those rather questionable analyses. A lot of people have misinterpreted them. For better analysis, see https://www.prosoundtraining.com/2014/05/31/digital-resolution-cd-quality/, https://nwavguy.blogspot.com/2011/09/noise-dynamic-range.html, and https://kenrockwell.com/tech/dynamic-range.htm for far better analyses which are based on what you can actually manage to record and playback in the real work. Also see https://www.audiosciencereview.com/forum/index.php?threads/philips-red-book.2138/#post-57881 for a spot-on debunk of this "120dB" nonsense. Also, https://www.audiosciencereview.com/forum/index.php?threads/philips-red-book.2138/page-2#post-57905
Thinking this chart is going to tell you anything about sound quality listening to typical recorded music in anything resembling a typical playback scenario would be foolish. But, audio has always been full of people happy to get fooled. Now, if you have a dedicated listening room with 1000wpc worth of amplification, heavy treatment, and extraordinarily expensive speakers, it might be another story if you need that last nth detail on perhaps .1% of recordings.
Do you mind if I change this to: For example I need no hint to remember that dynamic range of CD is 96dB, but ...I remember that absolute human hearing range is 120dB, but I need to calculate how much zeros there should be in percentage.
dB is just a lot easier to read, remember and compare. That was my point.
120dB is just a value that came to mind that frequently used here for measurebating.
To new/lazy/non-geeky members:
Apart from the apperance of graphs, some figures also got revised in newer measurements and not reflected on the chart:
Asus STX II in 24-bit(>101dB)
https://www.audiosciencereview.com/...f-asus-stx-ii-pci-sound-card.4915/post-111244
SMSL Sanskirt USB with external power (106dB)
https://www.audiosciencereview.com/...ts-of-smsl-sanskrit-10th-dac.5702/post-127278
Modi3 got better DNR in newer measurements.
https://www.audiosciencereview.com/...ts-of-smsl-sanskrit-10th-dac.5702/post-127312
Here is the old one:
https://www.audiosciencereview.com/...rements-of-schiit-modi-3-dac.4742/post-104825
- Joined
- Nov 6, 2018
- Messages
- 170
- Likes
- 182
https://public.tableau.com/profile/...mparisondashboardalpha/DACComparisonDashboard
Tableau version, with some filters. Note: the details aside from DAC make/model/SINAD are not complete, which will lead to odd filtering behavior if you exclude "Null" from anything.
Tableau version, with some filters. Note: the details aside from DAC make/model/SINAD are not complete, which will lead to odd filtering behavior if you exclude "Null" from anything.
https://public.tableau.com/profile/...mparisondashboardalpha/DACComparisonDashboard
Tableau version, with some filters. Note: the details aside from DAC make/model/SINAD are not complete, which will lead to odd filtering behavior if you exclude "Null" from anything.
This implementation wins.
Arvind
Active Member
Thanks Amir for your great service towards saving audio customers from being befooled.I had randomly picked the colors for testing. Here it is now with latest suggestions:
View attachment 21589
One humble suggestion that: SINAD scores may also be given at the start of bar. It will be easy to read it alongside name of the DAC, as in the mobile devices one has to zoom to read name as well as score and at a time only one end of the bar remain visible.
I would also like to see this SINAD Chart as sticky, so that any one could get comparison at a glance without going into review page of any DAC.
OP
- Thread Starter
- #78
My pleasure. Do you mean something like this:Thanks Amir for your great service towards saving audio customers from being befooled.
One humble suggestion that: SINAD scores may also be given at the start of bar. It will be easy to read it alongside name of the DAC, as in the mobile devices one has to zoom to read name as well as score and at a time only one end of the bar remain visible.
It is a sticky already. Just go to Home page and click on the graph.I would also like to see this SINAD Chart as sticky, so that any one could get comparison at a glance without going into review page of any DAC.
OP
- Thread Starter
- #80
I have a local lead for the RME DAC. But just too much going on right now so likely happen in March.
Similar threads
- Replies
- 25
- Views
- 1K
- Replies
- 1
- Views
- 319
- Replies
- 1
- Views
- 407
- Replies
- 2
- Views
- 1K
- Replies
- 391
- Views
- 24K