Hi everyone! I've been educating myself around headphone THD measurements, and it's been very helpful to read many interesting posts in this forum, namely to learn how several potential distortion problems are not reflected in THD graphs.
However, I would still like to understand why there seems to be a consensus around many sources that you're likely not to experience audible distortion if THD measurements remain under 1% for frequencies above 100Hz. How do we get to such magic number? As far as I understand, 1% means that the distortion will be 40dB under the fundamental test signal. How isn't that likely to be audible with a 90dB test tone at 1kHz f.ex.?
Bonus question, probably related - when THD sweep measurements are said to be made with test tones at, say, 90dB SPL, those 90dB are unweighted, right? And that is why it is acceptable to have higher THD percentages in the low frequencies, as in those frequencies an unweighted 90dB SPL will be less audible, which means a bigger percentage of it will be inaudible. Or am I misunderstanding something?
Thanks!
Alas this isn't as simple as it looks and there are several reasons why this is so.
1: We don't listen to test tones. In music there isn't just a single tone and maybe its harmonics. There are many tones with its harmonics and IM products to begin with. These tones also aren't constant in amplitude and change harmonics. Also the spread of harmonics differ.
Our hearing doesn't work similar to analyzers. It analyzes things that are important for humans to survive and is more or less 'forgiving' with music than with test tones.
2: Then there is masking which works asymmetrical and is also level dependent.
3: There is lots more 'energy' in the lows than in the mids and treble. This is partly because of the non linear way the hearing works (equal loudness contours)
4: Distortion in transducers increases in a non-linear way. Distortion can be quite low up to a certain SPL and can climb fast above a certain level where large excursions become an issue (lowest frequencies) or cone break-up worsens (higher mids, lower treble).
Measurements are made at higher SPL because we need to have: A: a good S/N ratio from the mic/pre-amp B: A level people tend to listen at. C: We like to make comparable plots so use a constant amplitude while making the plot instead of that of say pink noise.
When listening loud we do not perceive 90dB SPL as loud for the lowest frequencies but 4kHz is perceived as loud.
When maximum excursions exist (in the lows) the other frequencies are also amplitude modulated around the peaks of the lower frequencies with large amplitudes which also becomes audible (IM).
5: Seemingly simple distortion plots are just as easy to interpret as say the ones from A DAC or amp.
They are not. Especially the percentage plots can be very deceiving as they are referenced to the actual signal level.
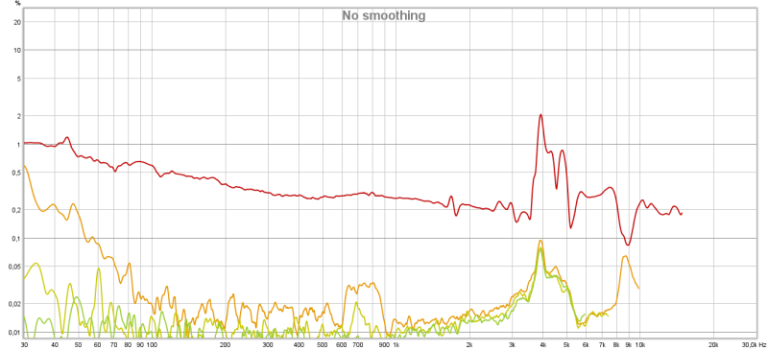
Below an example. Not one headphone has a linear frequency response and ear/driver interaction between one's ears and the measurement rig also can differ.
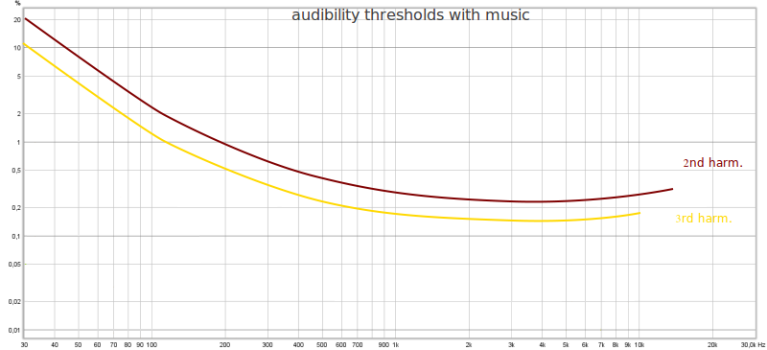
A plot of the audibility of distortion levels when using music.(based on some 'scientific' findings I found here and there)
This would lead one to believe the plot below has audible distortion levels around 4kHz.
But there is a catch. A percentage, just like a dB, is a ratio and a reference is needed. That reference happens to the the frequency response.
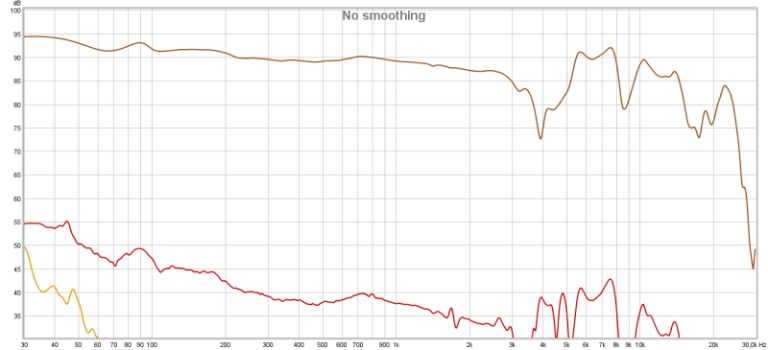
Notice how a dip occurs at 4kHz ? Because of this the distance between the reference and harmonics of that frequency differ so the percentage will rise but the actual level of the harmonics is from another frequency. 2nd harm. of 2kHz = 4kHz. The actual harmonics thus are still low in level (dB) but the percentage gives poor 'numbers'. Look at the plot below and see how the actual harmonics are not very high around kHz (so not audible) but the percentage plot makes it seem like it does,
6: Not all folks 'focus' on the same aspects when it comes to music enjoyment or aren't trained to detect certain kinds of distortion.
So distortion is a very complex subject that isn't as easy to interpret as just thinking well... so many dB's is inaudible so were fine.
When interpreting such plots correctly you need to take the things above in consideration and some more aspects I did not even write something about.
All one can really do is see if a headphone has some rather severe issues at a certain SPL. Even then a headphone may measure really bad at a high SPL but may measure (and sound) fine at normal listening levels, the kind one can listen to for longer than a few songs.
The most important aspect of headphones is frequency response and linearity at larger excursions (loudness of lowest frequencies). And for this we need to take the actual listening level into account.
Note that Amir likes to see where limits are. These limits may well far exceed those normal folks will ever reach. But when one, every now and then when one really likes a song, wants to blast it for a short moment these limits (for lowest frequencies) may easily be reached.
Only when you really care about super clean sound at those levels it may be wise to look at distortion plots at 'extreme' levels.