• WANTED: Happy members who like to discuss audio and other topics related to our interest. Desire to learn and share knowledge of science required. There are many reviews of audio hardware and expert members to help answer your questions. Click here to have your audio equipment measured for free!

Can you hear a difference between dac+amp path with 92dB vs. 78dB SINAD? (test)

Can you hear a difference between the files

  • I can hear a difference and I have an ABX result

    Votes: 2 9.1%
  • I can hear a difference and I do not have an ABX result

    Votes: 3 13.6%
  • I cannot hear a difference

    Votes: 17 77.3%

  • Total voters
    22
  • Poll closed .
It is very, very interesting that the chain with worse SINAD and worse noise, Chain2, is closer to original data than the Chain1 which measures better in a traditional view.
Can't reproduce, I get this:
dacamp_delta.png
 
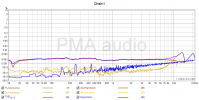
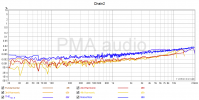
How come there's such a big difference in chain2 THD in those graphs (0.00098% vs almost 0.005%)?
Quite simply, THD vs. frequency was measured in REW by frequency sweep, not by a stepped sine, because of stepped sine measurement is time consuming. Frequency sweep measurement is much more affected by noise floor, as you can read from REW manual.


Although much, much slower than a log sweep the stepped sine measurement can measure low distortion levels much more accurately than a sweep, particularly at high frequencies and for higher harmonics.

dacamptest_thdfreq_chain1.png dacamptest_thdfreq_chain2.png

The high noise in Chain2 is the reason of lower sweep resolution compared to single frequency spectrum analysis.

Re your later post, Deltawave setting?
Below from Audacity, so it is not the difference between Audition and Audacity
delta_audacity.png
 
Last edited:
Are these differences adjusted for a delay and a clock speeds? If not for both, then it is possible that the worse DAC has its clock more in sync with ADC than the other one.
Deltawave settings:

Report
Settings:
Gain:True, Remove DC:True
Non-linear Gain EQ:False Non-linear Phase EQ: False
EQ FFT Size:65536, EQ Frequency Cut: 0Hz - 0Hz, EQ Threshold: -160dB
Correct Drift:True, Precision:30, Subsample Align:True
Non-Linear drift Correction:True
Upsample:False, Window:Hann
Spectrum Window:Kaiser10, Spectrum Size:262144
Spectrogram Window:Hann, Spectrogram Size:4096, Spectrogram Steps:2048
Filter Type:FIR, window:Hann, taps:8192, minimum phase=False
Dither:False
Trim Silence:True
Enable Simple Waveform Measurement: False

The difference in phase response??

Chain1dacamp_test1-orig.png Chain2 dacamp_test2-orig.png
 
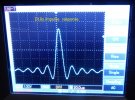
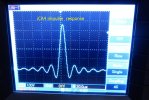
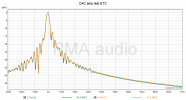
BTW, impulse responses are or are not a hint??

D10s_impulse.JPG iCA4_impulse.JPG ETC dacamptest_ETC.png
 
Even though I won’t be able to hear the difference, I prefer to have dac/amp with higher SINAD because SINAD is very expensive.
 
Amateur subjective result from my shot ears via cheap in-ears which mimic the 'aids quite well - I felt/imagined that one sample seemed to have added reverb and the other had the drummer playing in a room.. No way could I pass an ABX test with it, but I switched back and forth a good few times and still came to the same conclusion. Superficially though, they're absolutely identical so may well be over-active imagination going on here ;)

Maybe a sales pitch, but the UK importer of Melco digital products insists that subjectively, it's the 'back of the room' in suitable recording that can be heard in these things.

I think I need to lay back down in a dark room somewhere, sorry fellas - as you were, as you were...
 
  • Like
Reactions: pma
I appreciate the effort, and creating awareness and tests but I did not participate as I already know the differences are impossible to hear (despite being measurable) unless it is done 'sighted'.
 
I appreciate the effort, and creating awareness and tests but I did not participate as I already know the differences are impossible to hear (despite being measurable) unless it is done 'sighted'.
What difference is required to hear it?
 
Bigger than what these measurements show.
Also it may even be listening material, transducer and listening level dependent in some cases.
One cannot say what numbers for what type of measurements are needed to reach audible thresholds... too many variables for that including recordings and listeners.
 
Last edited:
What difference is required to hear it?

This strongly depends on differences in transfer functions. There does not exist a simple answer to this complex question. Even if you are quite experienced, you will have hard times to guess possible audible differences from usual sets of measurements, like those posted here at ASR. Measurements are necessary to make, but interpretation and correlation with audibility is difficult to tell even for an experienced professional and impossible to tell for a usual reader.

In most cases, tape recorder S/N of 50dB and distortion of several % is inaudible.
 
Re your later post, Deltawave setting?
AFAICT the only difference was non-linear drift correction, but setting it to true hasn't changed anything. This:
Code:
DeltaWave v2.0.10, 2023-11-25T10:49:56.8690083+01:00
Reference:  dacamp_orig.flac[L] 6660000 samples 96000Hz 24bits, stereo, MD5=f6d9e156164b3f8c0430695bedecc609
Comparison: dacamp_test2.flac[L] 6660000 samples 96000Hz 24bits, stereo, MD5=3629d861473e65d2dfeacb472f770840
Settings: 
	Gain:True, Remove DC:True
	Non-linear Gain EQ:False	Non-linear Phase EQ: False
	EQ FFT Size:65536, EQ Frequency Cut: 0Hz - 0Hz, EQ Threshold: -500dB
	Correct Non-linearity: False
	Correct Drift:True, Precision:30, Subsample Align:True
	Non-Linear drift Correction:True
	Upsample:False, Window:Kaiser
	Spectrum Window:Kaiser, Spectrum Size:32768
	Spectrogram Window:Hann, Spectrogram Size:4096, Spectrogram Steps:2048
	Filter Type:FIR, window:Kaiser, taps:262144, minimum phase=False
	Dither:False bits=0
	Trim Silence:True
	Enable Simple Waveform Measurement: False

Discarding Reference:  Start=0s, End=0s
Discarding Comparison: Start=0s, End=0s

Initial peak values Reference: -0.838dB   Comparison: -0.773dB
Initial RMS values Reference: -15.423dB   Comparison: -15.422dB

Null Depth=17.649dB
Trimming 192000 samples at start and 50 samples at the end that are below -90.31dB level

X-Correlation offset: 63 samples
Trimming 0 samples at start and 0 samples at the end that are below -90.31dB level

Drift computation quality, #1: Excellent (0.1μs)


Trimmed 19286 samples ( 200.895833ms) front, 38505 samples ( 401.09375ms end)


Final peak values Reference: -0.838dB   Comparison: -0.764dB
Final RMS values Reference: -15.262dB   Comparison: -15.256dB

Gain= -0.0068dB (0.9992x) DC=0 Phase offset=0.5557ms (53.347 samples)
Difference (rms) = -32.37dB [-32.45dBA]
Correlated Null Depth=43.94dB [37.09dBA]
Clock drift: 11.48 ppm


Files are NOT a bit-perfect match (match=0.09%) at 16 bits
Files are NOT a bit-perfect match (match=0%) at 24 bits
Files match @ 49.9984% when reduced to 6.23 bits


---- Phase difference (full bandwidth): 124.730519454468°
	0-10kHz: 44.16°
	0-20kHz: 87.05°
	0-24kHz: 99.28°
Timing error (rms jitter): 889.5ns
PK Metric (step=400ms, overlap=50%):
RMS=-57.6dBFS
Median=-60.9
Max=-43.4

99%: -49.38
75%: -56.71
50%: -60.94
25%: -65.56
1%: -72.66

gn=1.00078010491943, dc=1.23446118539299E-06, dr=1.14844108469869E-05, of=53.3472015517

DONE!

Signature: ab38388952062b9b98aa6790d0559457

RMS of the difference of spectra: -76.2953684318295dB
DF Metric (step=400ms, overlap=0%):
Median=-23.5dB
Max=-13.9dB Min=-34.3dB

1% > -33.39dB
10% > -31.36dB
25% > -28.76dB
50% > -23.47dB
75% > -18.24dB
90% > -15.99dB
99% > -13.75dB

Linearity 2.1bits @ 0.5dB error
---- Phase difference (full bandwidth): 116.84289334647°
	0-10kHz: 44.09°
	0-20kHz: 86.72°
	0-24kHz: 100.83°
Linearity 2.1bits @ 0.5dB error
produces this:
wave_delta_2.png


Chain 1 for completeness:
Code:
DeltaWave v2.0.10, 2023-11-25T11:08:58.3274330+01:00
Reference:  dacamp_orig.flac[L] 6660000 samples 96000Hz 24bits, stereo, MD5=f6d9e156164b3f8c0430695bedecc609
Comparison: dacamp_test1.flac[L] 6660000 samples 96000Hz 24bits, stereo, MD5=94d6f4ea282335b5e87116639a10f1f1
Settings: 
	Gain:True, Remove DC:True
	Non-linear Gain EQ:False	Non-linear Phase EQ: False
	EQ FFT Size:65536, EQ Frequency Cut: 0Hz - 0Hz, EQ Threshold: -500dB
	Correct Non-linearity: False
	Correct Drift:True, Precision:30, Subsample Align:True
	Non-Linear drift Correction:True
	Upsample:False, Window:Kaiser
	Spectrum Window:Kaiser, Spectrum Size:32768
	Spectrogram Window:Hann, Spectrogram Size:4096, Spectrogram Steps:2048
	Filter Type:FIR, window:Kaiser, taps:262144, minimum phase=False
	Dither:False bits=0
	Trim Silence:True
	Enable Simple Waveform Measurement: False

Discarding Reference:  Start=0s, End=0s
Discarding Comparison: Start=0s, End=0s

Initial peak values Reference: -0.838dB   Comparison: -0.755dB
Initial RMS values Reference: -15.423dB   Comparison: -15.374dB

Null Depth=27.229dB
Trimming 192000 samples at start and 17 samples at the end that are below -90.31dB level

X-Correlation offset: 23 samples
Trimming 0 samples at start and 0 samples at the end that are below -90.31dB level

Drift computation quality, #1: Excellent (0.23μs)


Trimmed 13992 samples ( 145.75ms) front, 72235 samples ( 752.447917ms end)


Final peak values Reference: -0.838dB   Comparison: -0.818dB
Final RMS values Reference: -15.278dB   Comparison: -15.277dB

Gain= 0.0526dB (1.0061x) DC=0 Phase offset=0.260427ms (25.001 samples)
Difference (rms) = -38.34dB [-38.49dBA]
Correlated Null Depth=51.53dB [43.22dBA]
Clock drift: -1.35 ppm


Files are NOT a bit-perfect match (match=0.18%) at 16 bits
Files are NOT a bit-perfect match (match=0%) at 24 bits
Files match @ 49.9963% when reduced to 7.21 bits


---- Phase difference (full bandwidth): 79.8830961072748°
	0-10kHz: 21.75°
	0-20kHz: 42.76°
	0-24kHz: 50.00°
Timing error (rms jitter): 492.7ns
PK Metric (step=400ms, overlap=50%):
RMS=-63.4dBFS
Median=-66.9
Max=-52.2

99%: -54.1
75%: -63.37
50%: -66.94
25%: -72.27
1%: -80.53

gn=0.993964760802358, dc=1.11260273831962E-06, dr=-1.34568928222651E-06, of=25.0010066197

DONE!

Signature: fc755558590885b317bfeb28d12f9226

RMS of the difference of spectra: -82.3416069416558dB
DF Metric (step=400ms, overlap=0%):
Median=-29.1dB
Max=-19.3dB Min=-39.5dB

1% > -38.61dB
10% > -36.99dB
25% > -34.43dB
50% > -29.12dB
75% > -24.26dB
90% > -21.84dB
99% > -18.88dB

Linearity 13.7bits @ 0.5dB error
wave_delta_1.png


The difference in phase response??
For me chain 1 looks similar but chain 2 does not:
phase_delta_2.png
 
AFAICT the only difference was non-linear drift correction, but setting it to true hasn't changed anything. This:
There must be some difference in settings, I am posting the complete one

Report
DeltaWave v1.0.70, 2023-11-24T15:41:14.0858798+01:00
Reference: dacamp_orig.flac[L] 6660000 samples 96000Hz 24bits, stereo, MD5=00
Comparison: dacamp_test2.flac[L] 6660000 samples 96000Hz 24bits, stereo, MD5=00
Settings:
Gain:True, Remove DC:True
Non-linear Gain EQ:False Non-linear Phase EQ: False
EQ FFT Size:65536, EQ Frequency Cut: 0Hz - 0Hz, EQ Threshold: -160dB
Correct Drift:True, Precision:30, Subsample Align:True
Non-Linear drift Correction:True
Upsample:False, Window:Hann
Spectrum Window:Kaiser10, Spectrum Size:262144
Spectrogram Window:Hann, Spectrogram Size:4096, Spectrogram Steps:2048
Filter Type:FIR, window:Hann, taps:8192, minimum phase=False
Dither:False
Trim Silence:True
Enable Simple Waveform Measurement: False
Discarding Reference: Start=0s, End=0s
Discarding Comparison: Start=0s, End=0s
Initial peak values Reference: -0.838dB Comparison: -0.773dB
Initial RMS values Reference: -15.423dB Comparison: -15.422dB
Null Depth=17.649dB
Trimming 192000 samples at start and 50 samples at the end that are below -90.31dB level
X-Correlation offset: 63 samples
Trimming 0 samples at start and 0 samples at the end that are below -90.31dB level
Drift computation quality, #1: Excellent (0.57μs)
Trimmed 254920 samples ( 2655.416667ms) front, 0 samples ( 0.00ms end)
Final peak values Reference: -0.838dB Comparison: -0.778dB
Final RMS values Reference: -15.25dB Comparison: -15.256dB
Gain= 0.0072dB (1.0008x) DC=0 Phase offset=0.561956ms (53.948 samples)
Difference (rms) = -46.3dB [-58.45dBA]
Correlated Null Depth=54.5dB [58.98dBA]
Clock drift: 11.46 ppm
Files are NOT a bit-perfect match (match=0.29%) at 16 bits
Files are NOT a bit-perfect match (match=0%) at 24 bits
Files match @ 49.9975% when reduced to 7.96 bits
---- Phase difference (full bandwidth): 7.55001381856993°
0-10kHz: 2.95°
0-20kHz: 3.88°
0-24kHz: 4.27°
Timing error (rms jitter): 891.6ns
RMS of the difference of spectra: -116.437357195116dB
DF Metric (step=400ms, overlap=0%):
Median=-35.7dB
Max=-29.2dB Min=-44.6dB
1% > -44.3dB
10% > -40.72dB
25% > -38.87dB
50% > -35.7dB
75% > -32.89dB
90% > -31.75dB
99% > -27.37dB
Linearity 15.4bits @ 0.5dB error
PK Metric (step=400ms, overlap=50%):
RMS=-58.3dBr
Median=-59.3
Max=-49.9
99%: -52.42
75%: -56.93
50%: -59.33
25%: -63.09
1%: -78.64
gn=0.999175944615891, dc=0, dr=1.14643392935713E-05, of=53.9477672528
DONE!
Signature: a3010c831e6dcaa48dbc50d96a1eb396

1700922031095.png


Anyway, this is a nit-picking, eyes and plots are not so important, ears and ABX results are.
 
Last edited:
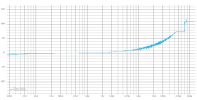
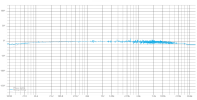
Some of the parameters of the preamp used in Chain1 in this test:

pre_dynrange.png


pre_xtalk.png

Input impedance is 200 kohm balanced, 100 kohm single-ended.
 
Last edited:
I tested using my desktop system:
  • Foobar2000
  • A fairly long playlist of the 2 tracks in a pseudorandom order
  • The playlist on a loop
  • Unsighted (didn't know which track was playing at any time)
I can't tell the difference.

Bravo @pma
 
Jesz This is easy. Put your ear into the tweater and turn up the volume and you can hear the difference .
My preamp han -112 db Noise level and Power amp -110. I can adjust the power amp gain by 0 -3 -6 and -12. At 0 I can hear a very faint hiss at -12 I cannot determine if the system is on or off…. That is the difference
So yes -92 or-78 is audible
When I play vinyl the noise floor is -50db , but it does not bother me at all..,

Who normally listens to music with their ear right next to the tweeter? ;)
 
Jesz This is easy. Put your ear into the tweater and turn up the volume and you can hear the difference .

Which files did you compare? Put the names, please, and part of the samples (time interval) where you can hear the hiss.
 
Back
Top Bottom