• WANTED: Happy members who like to discuss audio and other topics related to our interest. Desire to learn and share knowledge of science required. There are many reviews of audio hardware and expert members to help answer your questions. Click here to have your audio equipment measured for free!

Beta Test: Multitone Loopback Analyzer software

Sokel

Master Contributor
Joined
Sep 8, 2021
Messages
6,127
Likes
6,204
Another week, another update :)

This time, it's the preview version 1.1.9: https://app.box.com/s/ue7ll9xmvwogst817x2l1xg09opvgy47

A few fixes, enhancements, and some new features added:
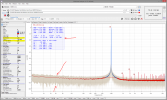
  1. Add: spectrum range display shows min and max values for all frequencies when spectrum is computed from averaged data
  2. Add: IMD+N variable to Level and Frequency sweeps
  3. Add: color selector property for 3rd measurement in Level and Frequency sweeps
  4. Add: option to position distortion panel on the left, in the center, or to the right (default)
  5. Add: line color indicators next to the Show 1 and Show 2 checkboxes are now clickable so you can change colors directly there, without opening the properties sheet
  6. Fix: color indicators are now shown on start up (previously were invisible until first measurement)
  7. Change: added automatic driver refresh on any audio device change (was previously disabled because it caused intermittent hangs)
  8. Add: various useful settings to both sweep property sheets
  9. Fix: in sweeps retry setting of 0 will no longer display a prompt when a large error occurs, effectively disabling retries
Details
1. Show signal swings around the average value in the spectrum plot. Lets you see how far the amplitude of each frequency deviates from the average during the whole capture. This will not be shown if average number is set to 1.
View attachment 359385

2. IMD+N is like THD+N, except it combines intermodulation and noise. This is similar to the measurements made by APx analyzers

3. Setting to change the color of the new, third variable in sweeps:

View attachment 359381

4. Panel Position setting on Spectrum plot. Possible values are Left, Center, and Right (default)

5. You can now click on the color indicators at the top to use Windows color selection dialog for plot series 1 or 2

View attachment 359382

7. The list of drivers in both, in and out drop-down lists will automatically update when audio devices are added, removed, or their properties changed (sample rate, bit length). Please test this, especially if you have a lot of ASIO devices. I'm hoping that I found the way to avoid the hang that would occasionally result from driver updates.
The automatic driver refresh needs a workaround probably.
Without doing anything it has gone in an endless loop.
 
OP
pkane

pkane

Master Contributor
Forum Donor
Joined
Aug 18, 2017
Messages
5,703
Likes
10,394
Location
North-East
OP
pkane

pkane

Master Contributor
Forum Donor
Joined
Aug 18, 2017
Messages
5,703
Likes
10,394
Location
North-East

Rja4000

Major Contributor
Forum Donor
Joined
May 31, 2019
Messages
2,767
Likes
4,709
Location
Liège, Belgium
Show signal swings around the average value in the spectrum plot. Lets you see how far the amplitude of each frequency deviates from the average during the whole capture. This will not be shown if average number is set to 1.
1711499189241.png
Love this one !
 

Balle Clorin

Major Contributor
Joined
Dec 26, 2017
Messages
1,347
Likes
1,219
I do not undertsand how i change the test/ evaluation signal. I read that is is possible but I have no clue how or where to enter any change
1711522956598.png


I have this IMD recorded file withn 400Hz and 4000Hz 4:1 OR 200 /4000 4:1..
1711523170827.png


1711524077927.png
 
Last edited:

Sokel

Master Contributor
Joined
Sep 8, 2021
Messages
6,127
Likes
6,204
OP
pkane

pkane

Master Contributor
Forum Donor
Joined
Aug 18, 2017
Messages
5,703
Likes
10,394
Location
North-East
I do not undertsand how i change the test/ evaluation signal. I read that is is possible but I have no clue how or where to enter any change
View attachment 359417

I have this IMD recorded file withn 400Hz and 4000Hz 4:1 OR 200 /4000 4:1..
View attachment 359418

View attachment 359423
As @Sokel pointed out, just start typing or modifying existing test signals in the Test Signal field. All test signals in MTA are configured using a line of text that specifies frequencies, phases, and amplitudes.

For your 400Hz and 4000Hz 4:1 example you'd enter:

Code:
MyNewTest 400/4k 4:1

If you want to add another two frequencies, say 20Hz and 8k to it with 400 still being 4:1 amplitude ratio to all the others (add as many frequencies as you want):

Code:
MyNewTest2 20/400/4k/8k 1:4:1:1

If you want to add phase for any or all the frequencies in the test, just add @deg after each frequency spec:

Code:
MyNewTest2 20Hz@90/400Hz@-90/4kHz@45/8kHz@-45 1:4:1:1

Here's that last test signal, measured:
1711540796682.png


There are some other specs (like square waves, etc.) that can also be used as part of the test signal.
 
OP
pkane

pkane

Master Contributor
Forum Donor
Joined
Aug 18, 2017
Messages
5,703
Likes
10,394
Location
North-East
@pkane
Can you use a wave file as source in "bitperfect" mode ?
If yes, is it possible with a 32 bits PCM WAV file ?

You can use a wave file as the source of the test signal. Is that what you're asking?

You can also drop a wave file into MTA for it to be analyzed as if it was recorded from the DUT.
 

Rja4000

Major Contributor
Forum Donor
Joined
May 31, 2019
Messages
2,767
Likes
4,709
Location
Liège, Belgium
You can use a wave file as the source of the test signal. Is that what you're asking?
Yes, that's what I try to do.
I see how to use a wave as source, but it's not bitperfect. Ans I can't find a way to force it.
As a test, playing RME bit test file doesn't display confirmation message.
You can also drop a wave file into MTA for it to be analyzed as if it was recorded from the DUT.
Yes, that way I've used extensively in the past, as you know. Very usefull.
 
OP
pkane

pkane

Master Contributor
Forum Donor
Joined
Aug 18, 2017
Messages
5,703
Likes
10,394
Location
North-East
Yes, that's what I try to do.
I see how to use a wave as source, but it's not bitperfect. Ans I can't find a way to force it.
As a test, playing RME bit test file doesn't display confirmation message.

Yes, that way I've used extensively in the past, as you know. Very usefull.
I'll take a look at some point as to why it isn't bit perfect. Many possible reasons, one that dither may be enabled. Another is that all data is managed in double-precision floating point internally in MTA and converted back to the appropriate format for device output, and converted into FP when imported.
 

Rja4000

Major Contributor
Forum Donor
Joined
May 31, 2019
Messages
2,767
Likes
4,709
Location
Liège, Belgium
How many FP bits ?
64 ?
But anyway, bit test file should display at least 24 bits confirmation on RME screen.
(Well, APx Flex shows 16 bits. But OK... And if you check the "bit perfect" checkbox, then it shows 32 bits)
 
OP
pkane

pkane

Master Contributor
Forum Donor
Joined
Aug 18, 2017
Messages
5,703
Likes
10,394
Location
North-East
How many FP bits ?
64 ?
But anyway, bit test file should display at least 24 bits confirmation on RME screen.
(Well, APx Flex shows 16 bits. But OK... And if you check the "bit perfect" checkbox, then it shows 32 bits)
Yes, 64 bit (double floating point) used internally.
 
OP
pkane

pkane

Master Contributor
Forum Donor
Joined
Aug 18, 2017
Messages
5,703
Likes
10,394
Location
North-East
Version 1.1.10 of Multitone is now officially released. This incorporates all the changes from preview versions 1.1.8 and 1.1.9, and includes new features (first two in the list shown in red):

Changes in 1.1.10

  • Add: Noise floor display in Spectrum plot selected by ‘Show Noise Floor’ setting
  • Change: clock drift calculation now works with a single tone and multi-tone test signals
  • Add: spectrum range display shows min and max values for all frequencies when spectrum is computed from averaged data
  • Add: IMD+N variable to Level and Frequency sweeps
  • Add: color selector property for 3rd measurement in Level and Frequency sweeps
  • Add: option to position distortion panel on the left, in the center, or to the right (default)
  • Add: line color indicators next to the Show 1 and Show 2 checkboxes are now clickable so you can change colors directly there, without opening the properties sheet
  • Fix: color indicators are now shown on start up (previously were invisible until first measurement)
  • Change: added automatic driver refresh on any audio device change (was previously disabled because it caused intermittent hangs)
  • Add: various useful settings to both sweep property sheets
  • Fix: in sweeps retry setting of 0 will no longer display a prompt when a large error occurs, effectively disabling retries
  • Add: retry measurement setting (number of retries, and TD+N difference from the previous result that causes it)
  • Add: third measurement to the plot, allowing up to three different variables to be compared
  • Add: harmonics 2,3,4, and 5 to the list of variables that can be plotted in sweeps
  • Add: support for custom expressions/computations to be used in place of pre-defined plot variables
  • Add: DSD modulator order setting for generating DSD test signals (4 - 7)
  • Change: removed clipboard zoom level setting from the Specturm Chart properties window
Noise floor display gives a visual indicator as to where the actual noise level resides in the spectrum:

1712181078403.png
 
Last edited:

Sokel

Master Contributor
Joined
Sep 8, 2021
Messages
6,127
Likes
6,204
Version 1.1.10 of Multitone is now officially released. This incorporates all the changes from preview versions 1.1.8 and 1.1.9, and includes new features (first two in the list shown in red):

Changes in 1.1.10

  • Add: Noise floor display in Spectrum plot selected by ‘Show Noise Floor’ setting
  • Change: clock drift calculation now works with a single tone and multi-tone test signals
  • Add: spectrum range display shows min and max values for all frequencies when spectrum is computed from averaged data
  • Add: IMD+N variable to Level and Frequency sweeps
  • Add: color selector property for 3rd measurement in Level and Frequency sweeps
  • Add: option to position distortion panel on the left, in the center, or to the right (default)
  • Add: line color indicators next to the Show 1 and Show 2 checkboxes are now clickable so you can change colors directly there, without opening the properties sheet
  • Fix: color indicators are now shown on start up (previously were invisible until first measurement)
  • Change: added automatic driver refresh on any audio device change (was previously disabled because it caused intermittent hangs)
  • Add: various useful settings to both sweep property sheets
  • Fix: in sweeps retry setting of 0 will no longer display a prompt when a large error occurs, effectively disabling retries
  • Add: retry measurement setting (number of retries, and TD+N difference from the previous result that causes it)
  • Add: third measurement to the plot, allowing up to three different variables to be compared
  • Add: harmonics 2,3,4, and 5 to the list of variables that can be plotted in sweeps
  • Add: support for custom expressions/computations to be used in place of pre-defined plot variables
  • Add: DSD modulator order setting for generating DSD test signals (4 - 7)
  • Change: removed clipboard zoom level setting from the Specturm Chart properties window
Noise floor display gives a visual indicator as to where the actual noise level resides in the spectrum:

View attachment 361157
Oooh,that's nice one about the noise floor,thanks!


noise floor.PNG
 
Top Bottom