
Serge Smirnoff
Active Member
- Joined
- Dec 7, 2019
- Messages
- 240
- Likes
- 136
Hi everybody! This is my first post on the forum.
I would like to present results of audio measurements according to the new music-based audio metric which I developed. I think this listener-centric audio metric is mature enough to be discussed in public and the community of scientifically minded audio enthusiasts and professionals is the best place for the purpose.
Devices under the test are mostly portable audio. Some of them were also measured on this forum according to traditional audio metric.
In simple words the core idea of the new metric can be explained as follows. Traditional parameter THD measures the level of distortion/degradation of pure Sine wave. This audio parameter can be measured using different method/procedure. With this new method the level of distortion can be measured not only for Sine signals but also for Square, Triangle, White Noise, ..., any signals. Needless to say that distortion of real music signal can be measured as well. Thus, the new audio metric is based on generalized method of distortion measurement having THD+N as a special case when test signal is Sine. Such measurements with real music signals correlate well to perceived quality estimations and this relationship can be researched directly as the same signal can be used for both objective measurements and subjective evaluations.
The level of distortion is quantified by the parameter Difference Level (Df), which shows ... the difference in dB between two waveforms. Measurement algorithm does not account linear distortion of both coordinate axes of waveform - time and amplitude. So, only degradation of waveform “structure” is measured; DC-offset/amplitude and pitch/phase shift are not accounted (details of the algo can be discussed separately if anybody interested in). Df can be measured using various time windows: 50, 100, 400, 3000 ... ms. Examples below use 400ms window.
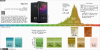
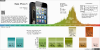
Let's have a look at some real-life df-measurements in order to have some idea of scale, sensitivity and accuracy of Df parameter. I will use the measurements that were performed in cooperation with the member of Head-Fi forum - csglinux. He made recordings of some high-end portable players with his RME Babyface Pro; I computed Df values and put them on df-slides. Each df-slide shows level of degradation for 10 technical signals and one real-life audio signal (two hours of various music material).
Here is results of testing the best and the worst among 11 tested devices:


Pure Sine signals in both devices are distorted almost similarly while other tech signals are distorted more heavily in FiiO. Predictably the overall distortion of real audio signal is also higher (+7.8dB, histogram median). Such difference in quality will be audible for sure. For simplicity of explanation we can safely assume here that 1-2dB difference is not perceptible for human hearing.
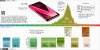
Another two examples shows df-measurements of LG V30 in two modes - low impedance and high impedance:

@SE.png")
As expected, almost identical Df values for all signals (including real-life) and small differences for Sine1k and 1-bit signal.
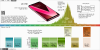
Another two df-slides show devices, which use the same audio solution inside:


All signals have the same Df levels ... except both pure Sine waves (1k and 12.5k)
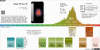
This device was measured in two filter modes - steep and gradual:


With gradual filter mode most tech signals have worse Df levels but resulting Df level with real music signal lost only 0.1dB and this is too small for perception.
The device above was measured using less accurate recorder M-Audio Microtrack 96/24 (see Testing Diagram). Yes, quality of recorder affects df-measurements but the relation is not trivial. Below are two df-slides of the same device measured with recorders of different precision:


Df-measurements with some signals are equal for both recorders, others differ to different extent. The most important indicator - Df with real-life signal is 3dB better with better recorder. So, measurement recorder/interface should be mentioned in the reports. But within a class of recorders/interfaces with comparable precision Df levels are consistent, can be compared and used for inference about perceived audio quality. This recorder-dependency can be considered as a drawback of this measurement method. On the other hand this dependency reflects the natural fact that resulting audio measurements depend on quality of measurement interface. In df-metric this fact is just explicitly visible. So, measurement interface must be better than device under test )).
Df-slides of other devices can be found here - http://soundexpert.org/articles/-/blogs/audio-quality-of-high-end-portable-players
How to read df-slides - http://soundexpert.org/portable-players#howtoreaddfslides
One-page introduction to df-metric - http://soundexpert.org/documents/10179/11017/se-audio-metric.pdf
Tech. signals used for testing - http://soundexpert.org/test-signals
Audio material used for testing - http://soundexpert.org/test-signals#variety
Many questions and features of the new metric left beyond the scope of this post including the very important one - are Df levels correlate well to perceived audio quality in all cases or there are some limitations (spoiler: yes, there are some limitations). In order to answer the question I need to explain the concept of artifact signatures, which is essential part of df-metric (artifact signatures can be quantified and compared). Also some features/bugs of the metric remains questionable and need additional research (similarity metric for artifact signatures as an example). Nevertheless, I hope the basic idea of the new metric/measurements is pretty clear now and I'll be thankful for your comments, questions and objections.
-- Serge Smirnoff
I would like to present results of audio measurements according to the new music-based audio metric which I developed. I think this listener-centric audio metric is mature enough to be discussed in public and the community of scientifically minded audio enthusiasts and professionals is the best place for the purpose.
Devices under the test are mostly portable audio. Some of them were also measured on this forum according to traditional audio metric.
In simple words the core idea of the new metric can be explained as follows. Traditional parameter THD measures the level of distortion/degradation of pure Sine wave. This audio parameter can be measured using different method/procedure. With this new method the level of distortion can be measured not only for Sine signals but also for Square, Triangle, White Noise, ..., any signals. Needless to say that distortion of real music signal can be measured as well. Thus, the new audio metric is based on generalized method of distortion measurement having THD+N as a special case when test signal is Sine. Such measurements with real music signals correlate well to perceived quality estimations and this relationship can be researched directly as the same signal can be used for both objective measurements and subjective evaluations.
The level of distortion is quantified by the parameter Difference Level (Df), which shows ... the difference in dB between two waveforms. Measurement algorithm does not account linear distortion of both coordinate axes of waveform - time and amplitude. So, only degradation of waveform “structure” is measured; DC-offset/amplitude and pitch/phase shift are not accounted (details of the algo can be discussed separately if anybody interested in). Df can be measured using various time windows: 50, 100, 400, 3000 ... ms. Examples below use 400ms window.
Let's have a look at some real-life df-measurements in order to have some idea of scale, sensitivity and accuracy of Df parameter. I will use the measurements that were performed in cooperation with the member of Head-Fi forum - csglinux. He made recordings of some high-end portable players with his RME Babyface Pro; I computed Df values and put them on df-slides. Each df-slide shows level of degradation for 10 technical signals and one real-life audio signal (two hours of various music material).
Here is results of testing the best and the worst among 11 tested devices:
Pure Sine signals in both devices are distorted almost similarly while other tech signals are distorted more heavily in FiiO. Predictably the overall distortion of real audio signal is also higher (+7.8dB, histogram median). Such difference in quality will be audible for sure. For simplicity of explanation we can safely assume here that 1-2dB difference is not perceptible for human hearing.
Another two examples shows df-measurements of LG V30 in two modes - low impedance and high impedance:
As expected, almost identical Df values for all signals (including real-life) and small differences for Sine1k and 1-bit signal.
Another two df-slides show devices, which use the same audio solution inside:
All signals have the same Df levels ... except both pure Sine waves (1k and 12.5k)
This device was measured in two filter modes - steep and gradual:
With gradual filter mode most tech signals have worse Df levels but resulting Df level with real music signal lost only 0.1dB and this is too small for perception.
The device above was measured using less accurate recorder M-Audio Microtrack 96/24 (see Testing Diagram). Yes, quality of recorder affects df-measurements but the relation is not trivial. Below are two df-slides of the same device measured with recorders of different precision:
Df-measurements with some signals are equal for both recorders, others differ to different extent. The most important indicator - Df with real-life signal is 3dB better with better recorder. So, measurement recorder/interface should be mentioned in the reports. But within a class of recorders/interfaces with comparable precision Df levels are consistent, can be compared and used for inference about perceived audio quality. This recorder-dependency can be considered as a drawback of this measurement method. On the other hand this dependency reflects the natural fact that resulting audio measurements depend on quality of measurement interface. In df-metric this fact is just explicitly visible. So, measurement interface must be better than device under test )).
Df-slides of other devices can be found here - http://soundexpert.org/articles/-/blogs/audio-quality-of-high-end-portable-players
How to read df-slides - http://soundexpert.org/portable-players#howtoreaddfslides
One-page introduction to df-metric - http://soundexpert.org/documents/10179/11017/se-audio-metric.pdf
Tech. signals used for testing - http://soundexpert.org/test-signals
Audio material used for testing - http://soundexpert.org/test-signals#variety
Many questions and features of the new metric left beyond the scope of this post including the very important one - are Df levels correlate well to perceived audio quality in all cases or there are some limitations (spoiler: yes, there are some limitations). In order to answer the question I need to explain the concept of artifact signatures, which is essential part of df-metric (artifact signatures can be quantified and compared). Also some features/bugs of the metric remains questionable and need additional research (similarity metric for artifact signatures as an example). Nevertheless, I hope the basic idea of the new metric/measurements is pretty clear now and I'll be thankful for your comments, questions and objections.
-- Serge Smirnoff
Attachments
-
 [email protected]177.8 KB · Views: 156
 -
 [email protected]173 KB · Views: 159
 -
 LGV30(high)@SE.png173.1 KB · Views: 144
 -
 [email protected]154.7 KB · Views: 157
 -
 [email protected]200.9 KB · Views: 131
")