• WANTED: Happy members who like to discuss audio and other topics related to our interest. Desire to learn and share knowledge of science required. There are many reviews of audio hardware and expert members to help answer your questions. Click here to have your audio equipment measured for free!

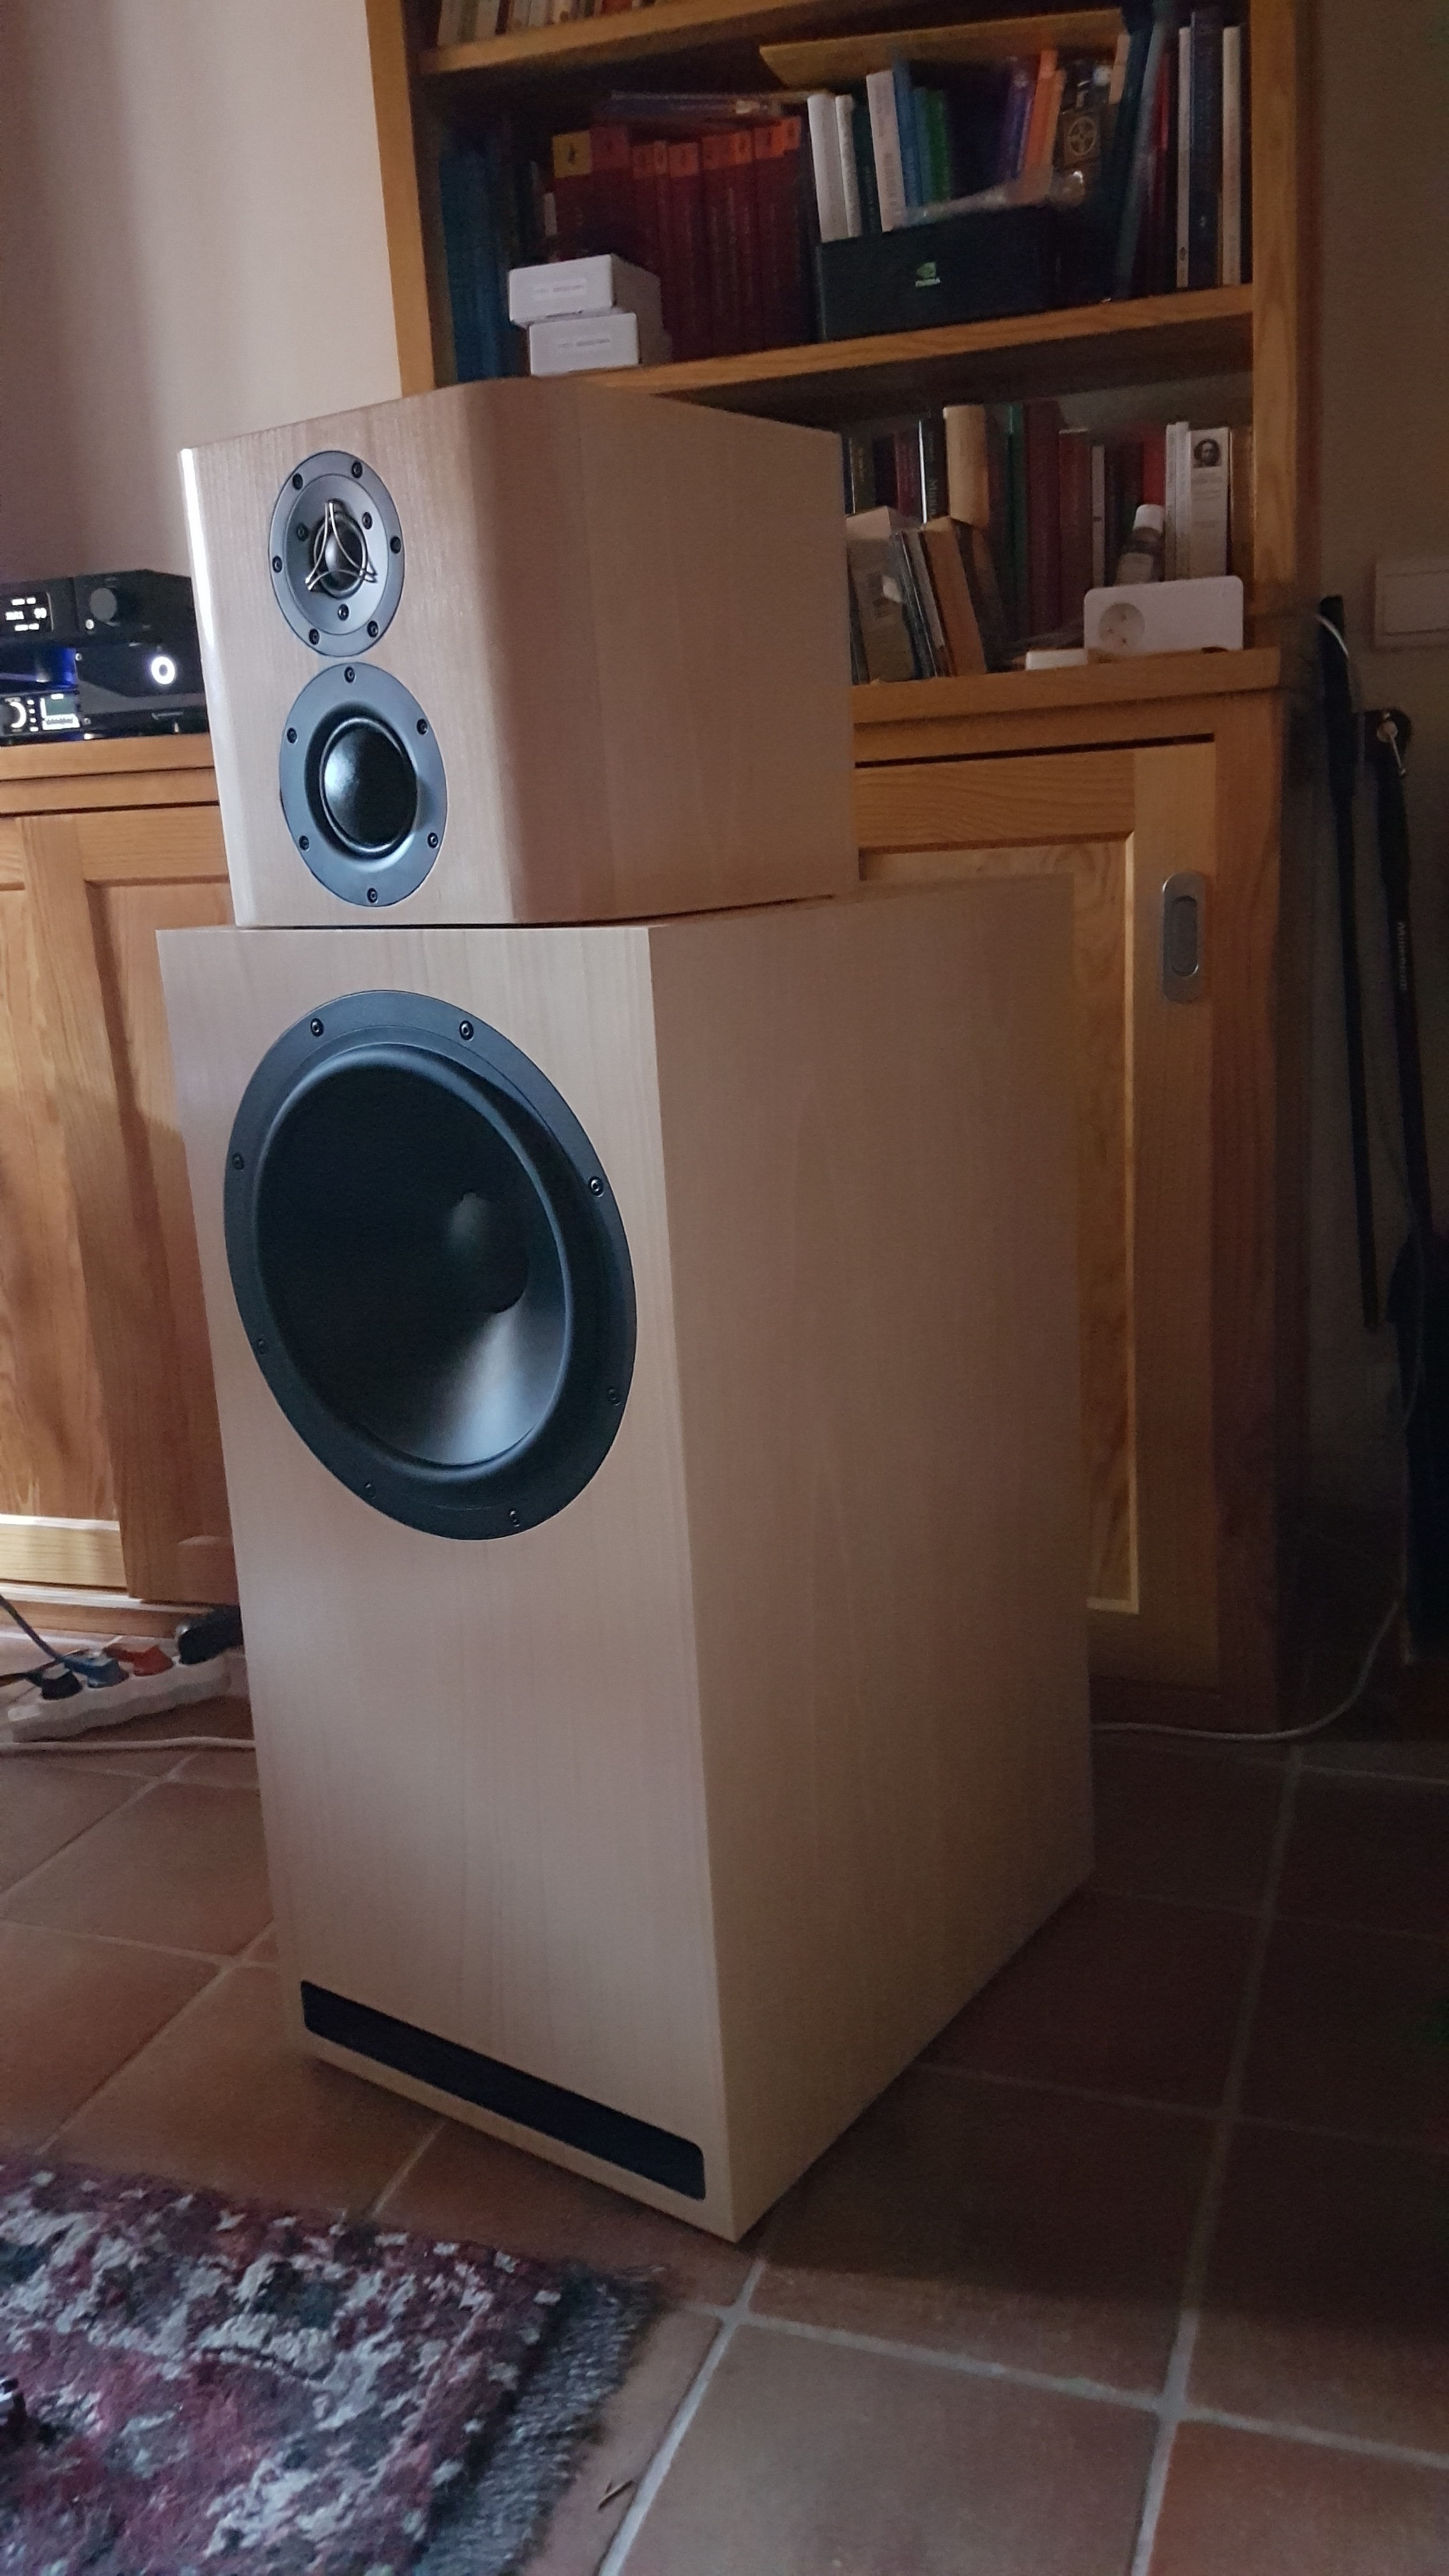
2-way 10'' speaker with swappable waveguides for constant/linear directivity

Of course I cannot comment or speculate possible or actual agreements between manufacturers and retailers. A dominant market position practically gives the possibility to control public information, but my original question was not commercial or ethical. Just keeping up discussion what physical or technical features in application or environment or their compatibility can create an opinion for some individuals or even majority that more advanced and modern product sounds systematically worse. In this thread I have tried to question importance of directivity - primarily quantity, but also quality within some limited frequency range and standards referred often on this forum. Is searching 1 dB variations from directivity responses at 200-15kHz adequate or just religious/prejudice due to limited experience including investigators. What has been overlooked or forgotten in fancy products with "controlled and strong directivity" if they sound weaker and more artificial than regular and traditional products.
 
On the other hand for the classic speaker horisontally asymmetrical baffles are definitely not my thing.
Aalto 9 was originally designed as symmetrical for flush-mount. The first three have Be-dome in quite shallow wave guide. That baffle model is available on request.
1732567034680.png
 
I have a set of poor directivity matched freestanding horn designs. Smaller 8 inch Dayton woofer in contrast to your far higher quality 10 inch PHL. I also use a lower quality compression driver (B&S DE111 vs your BMS 4553). I designed the waveguide in ATH with absolutely zero understanding of the in-room and sound power slope preferences kimmosto discussed in the thread. I optimized the waveguide for smooth looking and flat simulation lines - for a size that could fit my 3D printer - and then slapped a woofer to it after the fact.

However, my biggest pain point in audio isn't music quality. It's watching YouTube or movies and not understanding spoken dialogue. These speakers are excellent at that job. Some music sounds ok and some doesn't. Pop/rock music doesn't sound that great, for example. When I audition these speakers for friends who still listen to the music they did when they were 15 they aren't very impressed. Luckily I don't GAF about the music I listened to when I was 15.
 

Attachments

  • ES8FS46_de111_12k var2 Directivity (hor).png
    ES8FS46_de111_12k var2 Directivity (hor).png
    127 KB · Views: 76
  • ES8FS46_de111_12k var2 Power+DI.png
    ES8FS46_de111_12k var2 Power+DI.png
    28.9 KB · Views: 74
To be clear, I'm saying people probably shouldn't build what I built. I personally like them but they're a one trick pony.
 
Please show us the data !
I'm not sure what kind of data you're hoping for, but here is some very basic. For interpretation, it is worth considering the following:
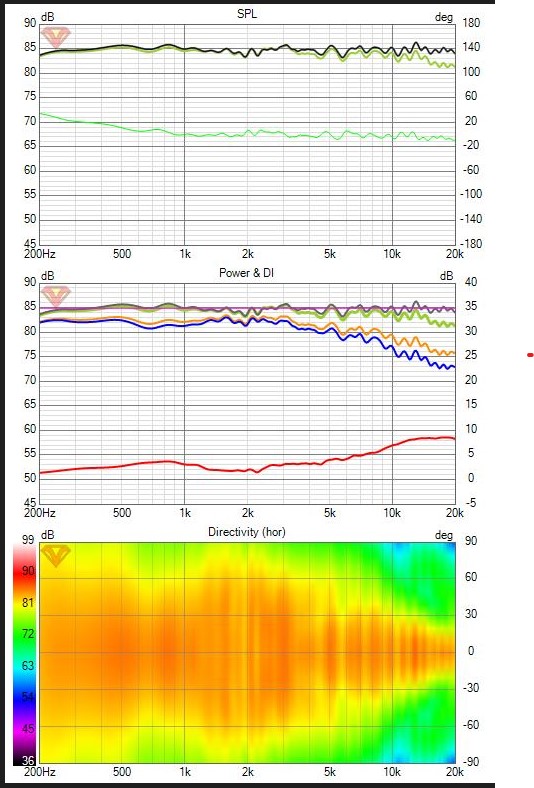
Original measurement data is quasi anechoic in free space from speaker with all drivers at vertical center line i.e. center speaker. That layout could be the only option in the future. Compression driver as tweeter. Far field is measured at 100 cm 0-180 deg with 10 deg steps, separately for each driver. Mid and woofer in hor plane only. Tweeter in both planes. Near field at max 10 mm from dust cap. Vents where constant diameter begins. Woofer+vents merged to far field responses at 200-230 Hz, and mid at 380 Hz. Measurement data and crossover simulation are combined with a simulator. FourAudio DSP amp is configured with 'FIR with speaker compensation' option so magnitude and phase responses are equalized automatically using linear phase textbook targets and measurements to reference axis. Simulator plays the same role with 'Transfer function file' block, but actual equalization is not so accurate due to selected maximum of FIR taps producing total latency of ca. 10.5 ms. House curve and directivity compensations are implemented with DSP's Master EQ. Simulation has the same parameters. Not very simple process, but this is how speakers are designed in a living room.

1732625070164.png


1732625084409.png


1732625100497.png


1732625129315.png


1732625163288.png


Few in-room measurements
This is average of left and right in the living room of Matti Hermunen, measured at ca. 3 m. 1-2 very small EQs at L.F., but could be without.
1732625395514.png


In-room step response. Very close to minimum phase also IRL.
1732625594927.png


P.S. RT60 and EDT in Matti's living room. Some locals may have been asking this for few years. Surprisingly okay though there are just few small acoustic panels on the walls.
1732625715595.png


This is somewhere else with Dirac optimized to one spot only with some house curve :p So don't take this too seriously.
1732626135453.png
 
Last edited:
Thanks for the thorough methods presentation, looks like quite a lot of work indeed but that's inspiring !
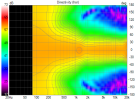
Nice power/DI slope, and nice midrange donut in that hor. heatmap ;).
The small DI saddle / power hump in the midrange register reminds me of the KH 310 dome mid filler :

index.php


Or much worse, some dome mid monstrosity I myself committed as 1st DIY :

YNQxOb-20220816-084034.jpg


Knh3Ob-PolarFranken.jpg


There might be something not entirely wrong with a little midrange directivity widening, afer all ;)
 
nice midrange donut in that hor. heatmap ;).
It would be nice to know how much there is actually at far field such as 3 m. Measuring 1300x620 mm box at 1000 mm with ca. 5 ms time window gives some result, but the nearest edge diffractions have greater weight in the data than in reality. There is some S-curve for sure, but for example in-room measurements does not show that or compensation is able to handle it. Pointing out +/-1 dB curves in directivity responses is one reason why I don't like to show design data. Reality can be worse or better, and significance is another question.
 
No doctrinal problem about such small irregularities, not to be overweighted vis-à-vis other characteristics not represented in the graphs such as full-range dynamics without compression, distortion and the like, plus how fit a given speaker is for a given room with its own acoustics, listening distance and SPL...
Whatever, thank you for sharing data and skills.
 
Sorry about temporary hijacking, but graph I referred, and few extras
View attachment 407769

View attachment 407770

View attachment 407772

View attachment 407774

Next one is affordable in-wall design. Target line is 6 dB @200-12000 Hz. Sample is not perfect, but should reveal why this concept is acoustically so brilliant compared to too small speakers with a horn or wave guide producing too much directivity along with edge diffraction. Unfortunately these are mechanically quite annoying.
View attachment 407776

This is just for a reference - that previous slope targets are possible in practice with shallow wave guide
View attachment 407802
Could you name or show the speakers which respond to the different graphs? I'm curious to how they are designed, what to expect!

And do I understand correctly you have come to the conclusion that the updated slopes in Vituixcad are corresponding better to a preffered home listening setup?
 
Could you name or show the speakers which respond to the different graphs? I'm curious to how they are designed, what to expect!
Tooltip shows filename
1. Neumann KH 150
2. Mechano23 by X-Mechanic
3. Genelec 8351B
4. Neumann KH 420
5. Koto 2F by Suomen Kaiutintehdas
this is vented in-wall design with 5.25"+1" without wave guide:
1732644169398.png

6. Aalto 3 by Aalto Speakers
And do I understand correctly you have come to the conclusion that the updated slopes in Vituixcad are corresponding better to a preffered home listening setup?
This is longer story, but I'll try to answer later.
 
And do I understand correctly you have come to the conclusion that the updated slopes in Vituixcad are corresponding better to a preffered home listening setup?
Short answer is "probably yes", but I promised something longer.

As we already know, result is always combination of speakers, speaker locations, environment and hearing locations. I'd like to use "hearing locations" instead of "listening position". Intensive and serious listening in a dedicated spot can be the only significant for some people, but some others could prefer or require subjectively acceptable sound balance in all "hearing locations". This has effect how balanced directivity responses should be in wide frequency range. Directivity balance of near field monitors can be quite bad compared to good speakers for casual listening in any location where program can be listened. Room acoustics and equalization can confuse and partly fix that equation so slope and magnitude of directivity can variate within some limits.

Default/initial slope targets for Full space design were higher in VCAD, but I have tried to bring them down towards some old studies from the previous millennium. Recommended power slope target of -0.85...-1.02 dB/oct. is quite challenging for almost any small 2-way speaker. 3+ -ways can hit into that tolerance much easier. Default PIR slope target is set to -0.65 dB/oct. with flat horizontal on-axis. That value is a bit closer to preferred in-room target than preferred headphone target by Olive. With that PIR target, a modern well-designed (imo) 2-way with shallow wave guide is able to produce power slope of ca. -1.2 dB/oct with flat horizontal on-axis so that is set to default/initial value.
Default targets are tilted a bit down from previous values to reduce effect of possible/probable peaks at H.F. and short time window while measuring drivers for designing XO. Higher slopes can also help with pressure leaks at L.F. and hard room boundaries, but primary target should always be good acoustics, for example smooth RT60 < 350 ms and primarily smooth EDT < 200 ms.

Default/initial slope targets for Half space design are set using reference speaker so that average of PIR and SP targets is about the same as with Full space design. Conventional in-wall speaker can fulfill those targets quite easily with small bass boost.

Default/initial slope targets for Constant DI design is just composed construction around PIR target of -0.85 dB/oct. which is the lowest recommended power slope. Constant DI is mostly theoretical concept, but it has some...utopian weight in discussion on DIY forums. Some say that it's the best directivity concept. Some others say that it's the best for enabling compensation with equalization. The truth could be either, but fortunately we don't need to go that far. In addition, traditions in record industry weight towards classic concepts. Constant DI is also difficult as cardioidish because of requirement to create uni-directional directivity index 5-6 dB down to 20 Hz. Omni and dipole are simpler to get close to constant DI.

Default/initial target values are good starting points, but you already have or will notice that acoustical design of the speaker or room acoustics won't always match with those targets. Then you just adjust target, optimize XO, listen, make conclusions and corrections. Next step could be making changes to acoustics or different directivity concept or whatever. Default targets could match better or worse, but listening tells all significant (because the speakers are not designed for measurements and reviews and judgements on ASR/EAC). This learning process continues until 6 ft under. That applies to me too.
 
Last edited:
2. Mechano23 by X-Mechanic


These are not actually Mechano23 characteristics or at least not for the prototype reference version. The proper graph shown below, the PR slope still a bit off the 1.2dB/oct target.
Mechano23ref_cta_.jpg


And just a subjective side note on the slopes and home listening. In my later design, Mechano24, the PR characteristic seems to be very close to 1.2dB/oct 100Hz-10kHz (as below). I was not very impressed with tonality of the new design at first. I was even tempted to make some EQ/tone adjustments but eventually gave it up after some hearing adaptation.
Mechano24f_cta_.jpg
 
These are not actually Mechano23 characteristics or at least not for the prototype reference version.
Data was downloaded from amirm's post #1. Then on-axis response was normalized with G(f) block to see slope of all power averages with flat on-axis.
Power slope with flat on-axis can also be detected indirectly by unchecking 'Listening window DI' in Options window
1732736951152.png

and looking slope of Sound Power DI (=1.82 dB/oct).
1732736884187.png


Too high directivity slopes have been compensated for decades by heating H.F. It may require some toe-in or toe-out while sitting in the spot. That method/trick works in practice up to some limit, but slope of directivity responses is still high which makes the speaker less versatile though it could be totally okay for some acoustics and locations and personal preference.
 
Last edited:
Data was downloaded from amirm's post #1.

That's true for the chart in this post (#33), but I was referring to the 2-nd chart in post #8, which looks a bit different.
It's not a big problem actually, sorry for OT
 
That's true for the chart in this post (#33), but I was referring to the 2-nd chart in post #8, which looks a bit different.
It has exactly the same data but with normalized on-axis.
1732802563001.png

There's tiny 0.01 dB/oct difference between power and DI because on-axis normalization does not extend down to 100 Hz. As already told (at least I hope) purpose of all this is to show all power averages with normalized on-axis which enables calculation of slopes including directivity only. That is required to be able to compare directivity features of different speakers. Just like normalized polar map: it shows directivity, but not final beam widths which could be adjusted and smoothed by the designer. Different views are serving different analyses.
 
It has exactly the same data but with normalized on-axis.
View attachment 410167
There's tiny 0.01 dB/oct difference between power and DI because on-axis normalization does not extend down to 100 Hz. As already told (at least I hope) purpose of all this is to show all power averages with normalized on-axis which enables calculation of slopes including directivity only. That is required to be able to compare directivity features of different speakers. Just like normalized polar map: it shows directivity, but not final beam widths which could be adjusted and smoothed by the designer. Different views are serving different analyses.

Thank you so much for explaining this again. As it turns out the only reason I'm spamming this thread with offtops is my inability to read with understanding. I do apologize for that.
 
Of course I cannot comment or speculate possible or actual agreements between manufacturers and retailers. A dominant market position practically gives the possibility to control public information, but my original question was not commercial or ethical. Just keeping up discussion what physical or technical features in application or environment or their compatibility can create an opinion for some individuals or even majority that more advanced and modern product sounds systematically worse. In this thread I have tried to question importance of directivity - primarily quantity, but also quality within some limited frequency range and standards referred often on this forum. Is searching 1 dB variations from directivity responses at 200-15kHz adequate or just religious/prejudice due to limited experience including investigators. What has been overlooked or forgotten in fancy products with "controlled and strong directivity" if they sound weaker and more artificial than regular and traditional products.
Interesting insights into speaker design. Are there any discussions on ASR's website related to the loudspeakers you have designed in more detail. Have you considered sending a finished model to be evaluated by ASR.
 
@eric tee

Have you noticed how some measurements via the NFS don't look so crash hot, but still sound good to Amir or Erin? eg. JBL M2, Google Nest Audio amongst others)

Many speakers some measure great, but there are other factors (un-related to price) that you make you prefer one to another

The methodology of reviews are OK to good. I'm certain that @amirm doesn't think they they are perfect, or have a 90% correlation which what he hears.
Are they better than the 1/3 octave on-axis measurements of yesteryear? Absolutely. But they could they be improved!

I have independently come to some views that are similar to one those expressed by Kimmo eg. normalized polar measurements (are only useful you normalise to flat on reference angle with FIR compute) limitations in harmonic distortion measurements (we are actually measuring our recording chain/process, not just of the speakers), improved way of testing with real music instead of sine tones (eg. M-noise vs multitone, FSAF vs sine)


I am NOT criticizing the reviewer, but I am reflective of the process. I have deep respect Sean and Floyd for their research work. But that does not mean it is finished. CEA/CTA2034 leave room for future investigation in directivity and/or distortion.

1733719140691.png


It also doesn't take into account the dozens of innovations that have occurred since the time of the original groundbreaking research process, which was a response to Consumer Reports reviews and measurements in the 1980s.

Now we have an opportunity to go further. A response to CTA2034A.
Or whether there are more useful graphs that comes out of the hours long measurement process from the NFS

CTA2034A is based on past research..

I still wonder why speakers of the last decade (2014-2024, usually small (0.7-7L internal volume) wireless and battery powered speakers may fall apart when scrutinized according to CTA2034A, but can still sound great! And MUCH better than speakers of last century (of the same size).

In fact, virtually all the models that were designed in the past century have been eclipsed by what's available in the market today- pound for pound
eg. soundbars, in-wall speakers, speakers the size of a hotdog (JBL Charge) or cheeseburger (UE Wonderboom 4) and sit on a table (Sonos Era 300), laptops eg. Macbook Pro 16" (twin dual opposed woofers and 2 tweeters, sophisated EQ and multichannel amplification)

The internet/Youtube reviewers seems to be the replacement of the hi-fi dealer Q&A/listener demo. The hi-fi dealer is sometimes looked upon as "someone who is trying to sell you stuff". But is that really fair, compared to the reviewer who is "trying to help you make a purchase decision"?

I hate to use car analogies. So I'm not going to. But no one bicycle type or size suits every single person. A single solution doesn't suit everybody.
If it did, Genelec, Neumann or KEF, so beloved by ASR readership, could just sell/market 1 model, right?
Let's not forget that at different stages of life you need different things.

It's fun to measure and all, but it's still important to listen in your room, with your music.
The wonderful mysteries continue...

PS. Good luck on the new venture @kimmosto
 
Last edited:
I have deep respect Sean and Floyd for their research work. But that does not mean it is finished. CEA/CTA2034 leave room for future investigation in directivity and/or distortion.
Most of the comments in that slide are related to development of the preference score, not measurements per 2034.
 
The preference score is derived from the spinorama now CEA/CTA2034A.

Preference scores aside, at what level of certainty can one predict a speakers subjective performance with its CTA2034 measurement alone?
 
Back
Top Bottom