• WANTED: Happy members who like to discuss audio and other topics related to our interest. Desire to learn and share knowledge of science required. There are many reviews of audio hardware and expert members to help answer your questions. Click here to have your audio equipment measured for free!

Neumann KH 80 DSP Monitor Review

Status
Not open for further replies.

Krunok

Major Contributor
Joined
Mar 25, 2018
Messages
4,600
Likes
3,069
Location
Zg, Cro
that's my last as I have to go: you are saying that if you take two different speakers, one measuring better than the other, and you correct both to the same target curve at the end they sound the same. I bet so, I wouldn't expect nothing different but it is obvious don't you think?

As I said, my guess was they would sound similar assuming both have reasonably good DI (spinorama). I never did that nor I heard anybody did such in-room experiment before @mitchco wrote about it. If both of them have reasonably good spinorama but differ in horizontal "spread" (as JBL and Neumann do) my guess was that it also could be audible if you don't sit still at your LP, and Mitch confirmed that.

I won't comment if that is obvious to you or anybody else on this forum but as I said, I don't remember anybody but Mitch conducting such experiment and stating that loud and clear in his article.
 

Krunok

Major Contributor
Joined
Mar 25, 2018
Messages
4,600
Likes
3,069
Location
Zg, Cro
But if you shipped everyone on ASR a 305P and a KH80 and crossed them both perfectly with a sub and used room EQ below schroeder, and then put everyone on house arrest and forced them to perform a blind test test with 100 songs, I'd be willing to bet Harman's entire research budget that the Neumann's would be preferred by some margin.

As you have access to many good measuring monitors instead of guessing why don't you take 2 of them, repeat Mitcho's expriment and tell us how it sounded to you.
 

napilopez

Major Contributor
Forum Donor
Joined
Oct 17, 2018
Messages
2,146
Likes
8,719
Location
NYC
As you have access to many good measuring monitors instead of guessing why don't you take 2 of them, repeat Mitcho's expriment and tell us how it sounded to you.

Well, I do actually have to, you know, work sometimes :). Audio isn't even my focus at my job. I also don't have the 305Ps. But it would be happy to try it sometime down the road :)
 

matt3421

Active Member
Joined
Jan 8, 2019
Messages
132
Likes
169
according to sound and recording, the "opening angle" for the KH 80 is only 100 degrees whereas it is 120 degrees for the LSR305. that might explain the differences in preference, assuming the 305P has the same performance
 

napilopez

Major Contributor
Forum Donor
Joined
Oct 17, 2018
Messages
2,146
Likes
8,719
Location
NYC
according to sound and recording, the "opening angle" for the KH 80 is only 100 degrees whereas it is 120 degrees for the LSR305. that might explain the differences in preference, assuming the 305P has the same performance

What's an opening angle? Not familiar with the term.
 

Ilkless

Major Contributor
Forum Donor
Joined
Jan 26, 2019
Messages
1,773
Likes
3,503
Location
Singapore
Someone could trace Amir's on-axis curve, together with the S&R, and Neumann's own, and then subtract any two of those (yielding a difference curve), to see whether they fall within Neumann's specified tolerances. If so, we can more safely conclude it is a mix of production variation and differences in reference axis.
 
Last edited:

napilopez

Major Contributor
Forum Donor
Joined
Oct 17, 2018
Messages
2,146
Likes
8,719
Location
NYC
Someone could trace Amir's on-axis curve, together with the S&R, and Neumann's own, and then subtract the differences from two of those or all of those, to see whether they fall within Neumann's specified tolerances. If so, we can more safely conclude it is a mix of production variation and differences in reference axis.

Neumann's tolerances are ±0.26 dB lol, so I'm not sure that's really going to help given differences in microphones and human error, which are surely larger.
Snag_1cd1ae47.png
That said, I think we've established the reasons for the variation. The 10-degree below tweeter axis curve lines up much more closely with the other existing measurements, and bass compression from apparently testing at 96dB@1m would explain the dip in the bass.

I'm guessing you don't plan on remeasuring the speaker @amirm as you have many more to get through, but it might just be good to clarify these points in the OP so people don't continue doubting the system. Not referring to you here specifically ilkless - just people in general who've been doubting the scanner, as it seems to come up every few pages in each of the reviews.

I do not think the differences are that relevant in the grand scheme of things, I just wanted to make sure the differences from existing data were accounted for. Including my own data, otherwise I would've driven myself nuts trying to figure out what was wrong =]
 
Last edited:

BYRTT

Addicted to Fun and Learning
Forum Donor
Joined
Nov 2, 2018
Messages
956
Likes
2,454
Location
Denmark (Jutland)
Someone could trace Amir's on-axis curve, together with the S&R, and Neumann's own, and then subtract any two of those (yielding a difference curve), to see whether they fall within Neumann's specified tolerances. If so, we can more safely conclude it is a mix of production variation and differences in reference axis.

NFS on axis verse one of the other Neuman curves shared in thread, for piece in mind above 12kHz area NFS on axis is extracted its microphone calibration curve.

Ilkless.png
 

Blumlein 88

Grand Contributor
Forum Donor
Joined
Feb 23, 2016
Messages
20,793
Likes
37,702
As I said, my guess was they would sound similar assuming both have reasonably good DI (spinorama). I never did that nor I heard anybody did such in-room experiment before @mitchco wrote about it. If both of them have reasonably good spinorama but differ in horizontal "spread" (as JBL and Neumann do) my guess was that it also could be audible if you don't sit still at your LP, and Mitch confirmed that.

I won't comment if that is obvious to you or anybody else on this forum but as I said, I don't remember anybody but Mitch conducting such experiment and stating that loud and clear in his article.
Years ago I did my own experiments using a Tact Room Correction device. It was quite surprising how close two different speakers could be made to sound with judicious use of the correction. In my case likely none were excellent in the spin o rama sense. Even then in a narrow, long room, I could put Soundlabs on one side, and a good box speaker on the other, pick target curves so neither speaker was left out, and the result was a quite acceptable to listen to stereo playback. If one restricts oneself to speakers already meeting good design goals in the spin o rama sense, then I could only think you would get better results still. That experience is one of a few that convince me that frequency response is the over-riding factor in most things we hear in stereo playback of music.
 

Thomas_A

Major Contributor
Forum Donor
Joined
Jun 20, 2019
Messages
3,469
Likes
2,467
Location
Sweden
NFS on axis verse one of the other Neuman curves shared in thread, for piece in mind above 12kHz area NFS on axis is extracted its microphone calibration curve.

View attachment 47110

At approx 95 dB @ 1 meter (which was the actual SPL?) this could perhaps stress the small woofer. Compression?
 

Juhazi

Major Contributor
Joined
Sep 15, 2018
Messages
1,725
Likes
2,910
Location
Finland
This argument during last few pages makes me want to remind, that there are other measurements too, spinorama/CEA doesn't tell everything about a loudspeaker! It is like arranging Miss Universe competition and judging the girls by their fingernails!

Armi-Kuusela%20(21).jpg
 

napilopez

Major Contributor
Forum Donor
Joined
Oct 17, 2018
Messages
2,146
Likes
8,719
Location
NYC
At approx 95 dB @ 1 meter (which was the actual SPL?) this could perhaps stress the small woofer. Compression?

Yeah, based on Neumann's own diagrams that would make sense:

Blue 3 percent THD, Green 1 percent. I'm guessing the Blue line also represents absolute max SPL? Note distance is 1.4m for some reason.

1579813181383.png
 

Thomas_A

Major Contributor
Forum Donor
Joined
Jun 20, 2019
Messages
3,469
Likes
2,467
Location
Sweden
Yeah, based on Neumann's own diagrams that would make sense:

Blue 3 percent THD, Green 1 percent. I'm guessing the Blue line also represents absolute max SPL? Note distance is 1.4m for some reason.

View attachment 47111
A bita strange graph, don't really understand what it says.
 

JIW

Senior Member
Joined
Nov 11, 2019
Messages
383
Likes
558
Location
Germany
Yeah, based on Neumann's own diagrams that would make sense:

Blue 3 percent THD, Green 1 percent. I'm guessing the Blue line also represents absolute max SPL? Note distance is 1.4m for some reason.

View attachment 47111

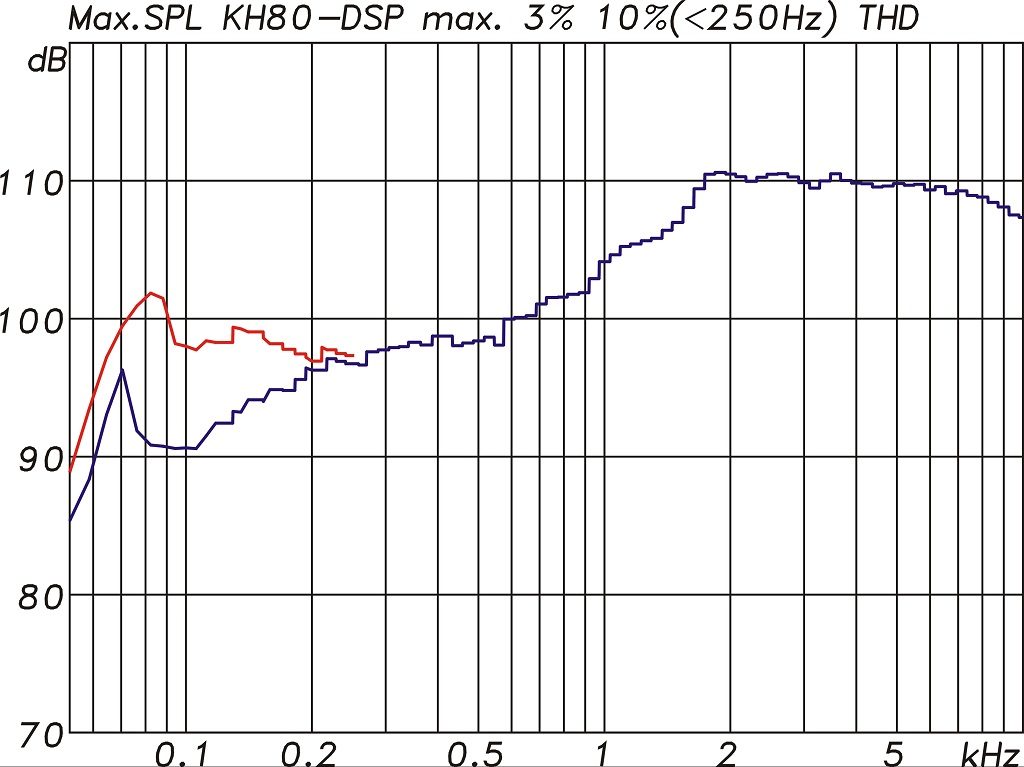
The S&R measurements shows greater SPL below 250 Hz at 10 % distortion.
KH80-MAX-1024x767.jpg


Neumann states on their page that it is at 1 m.
Screenshot 2020-01-23 at 22.09.57.png
 

Thomas_A

Major Contributor
Forum Donor
Joined
Jun 20, 2019
Messages
3,469
Likes
2,467
Location
Sweden
Still don't get what the graphs mean. The shape of the graphs differ <200 Hz. But don't understand how/why SPL increases relative to 1 kHz at higher distortion (= higher SPL?).
 

Vintage57

Senior Member
Forum Donor
Joined
Feb 2, 2018
Messages
412
Likes
596
Location
Ontario, Canada
If I’m reading this graph correctly, the max SPL @ 1 M is slightly above 90 dB if the intent is to maintain maximum 3% THD. Why would one push it and test it beyond this level without expecting a detrimental result.
 
OP
amirm

amirm

Founder/Admin
Staff Member
CFO (Chief Fun Officer)
Joined
Feb 13, 2016
Messages
44,722
Likes
241,580
Location
Seattle Area
If I’m reading this graph correctly, the max SPL @ 1 M is slightly above 90 dB if the intent is to maintain maximum 3% THD. Why would one push it and test it beyond this level without expecting a detrimental result.
Key to good measurement is high SNR to dwarf room noise. At least 40 db is recommended which is not very easy to do in bass given the lack of response in low frequencies. No overload was indicated by the speaker nor did I hear anything.
 

Thomas_A

Major Contributor
Forum Donor
Joined
Jun 20, 2019
Messages
3,469
Likes
2,467
Location
Sweden
To me it looks like compression. The shape of the curves <200 Hz differs between 1 % vs 3 % distortion, judging from their own picture. Don't know why the 10% distortion curve looks so different though.
 

oivavoi

Major Contributor
Forum Donor
Joined
Jan 12, 2017
Messages
1,721
Likes
1,940
Location
Oslo, Norway
What's an opening angle? Not familiar with the term.

I assume it's about the waveguide? New term for me as well. Might indicate that the LSR305 has wider dispersion in the higher frequencies and/or that the narrower waveguide of the Neumann creates more higher order modes, which might be audible but (according to Geddes) often don't show up on ordinary measurements.
 
Status
Not open for further replies.
Top Bottom