I just use a bench power supply with isolation circuit (Riden RD6012P) to float the amplifier boards, but that is if you are hooking up without a power supply that comes with the amplifier. They also have the plugs that can isolate the circuit from creating ground loops.
Other than that, I have an MSO5000 series unlocked oscilloscope. I can get a 1MSa/s 25kHz range FFT with that scope (it is an 8GSa/s scope), equaling about 2 second period. I currently cannot generate the .csv file with the ultrascope software from Rigol, so when I have time, I'll be testing dumping the memory to a USB or saving the samples in some other way, then running my own FFT on the samples.
My question is, would that be sufficient for generating some of the data for THD? THD+N?
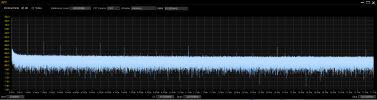
Also, I am wondering on the best way to take the FFT data, in dBV, and to properly create those charts seen. I usually have a noise floor around -69dBV with the FFT on the oscilloscope, unless I run it middle of the night with other electronics off and a less noisy mains, allowing for -74dBV up to -80dBV approx. And the MSO5000 allows for up to 15 points on the FFT, where you can vary the excursion, etc. to identify the harmonics and their dBV value.
My issue is making that data usable in charts for the audio community. What I mean by that is I need to find best practices on how to properly setup the input and values to get usable datum, how to convert from the dBV rms values to the charts, I need to build a notch filter to create an easy subtract scenario of the signal carrier and the 1kHz notch filtered to easily perform the ratio of signal noise distortion over noise distortion.
So I would be interested in if a person could point me toward resources, not tell me it is not possible. I can put the caveats of equipment and limitations when I post measurements.
This scope also does Bode plots, which I've had fun looking at to find the gain and phase of the amplifiers. But I'm still relatively new to audio and this is my first oscilloscope, so I'm still learning. Sure, it isn't a spectrum analyzer, but if you pull the points or have a large enough sample FFT, you can have some information that is usable.
So instead of nay-saying, can those with more experience explain how to do it, rather than why not to.

")