- Thread Starter
- #21

-
WANTED: Happy members who like to discuss audio and other topics related to our interest. Desire to learn and share knowledge of science required. There are many reviews of audio hardware and expert members to help answer your questions. Click here to have your audio equipment measured for free!
You are using an out of date browser. It may not display this or other websites correctly.
You should upgrade or use an alternative browser.
You should upgrade or use an alternative browser.
ernestcarl
Major Contributor
Is it not strange that I get almost no bass? Below 90 Hz the curve falls down soo fast.
Why it doesn't follow the expected slope is likely from positioning in the room. The bass roll-off in my own desk monitors is pretty steep. I just support them with a sub.
*but from your following posts it's apparently just a measurement issue?
Last edited:
ernestcarl
Major Contributor
Hi,
I now attempt to make a eq setting to use with roon. From the looks of the graph here I'm wondering why there is no correction for the dip around 60 Hz. Is it that I limit it too max 6 db boost?
Should I attempt to EQ 60 hz?
/Fredrik
Try manually boosting it by 4-5 dB. Check the effect in the decay time; distortion also at higher volume playback. I would not equalize the HF based on a single measurement -- better to use frequency dependent windowing (FDW) and smoothing and/or moving microphone method (MMM).
- Thread Starter
- #24
I meassured 5 times, sofa mid position, then moved mic up + down from there. After that 1 to the right and 1 to the left of the mid position at ear height.Try manually boosting it by 4-5 dB. Check the effect in the decay time; distortion also at higher volume playback. I would not equalize the HF based on a single measurement -- better to use frequency dependent windowing (FDW) and smoothing and/or moving microphone method (MMM).
I then took avg of that like in the video. But what is FDW or MMM, do you have any video of that?
thanks!
ernestcarl
Major Contributor
I meassured 5 times, sofa mid position, then moved mic up + down from there. After that 1 to the right and 1 to the left of the mid position at ear height.
I then took avg of that like in the video. But what is FDW or MMM, do you have any video of that?
thanks!
Since you would be adjusting the HF, for MMM, use the 90 degrees mic calibration and face it upwards while moving the mic.
FDW settings can be changed via the IR windows button in REW (left of the SPL button). Try using 5 cycles and additionally apply psy or var smoothing. You would need to vector average the 5 raw, unsmoothed measurements beforehand.
Mitch explains FDW here:
There are or more customizable ways to apply FDW using other programs like DRC-FIR.
*The amount of HF shelving to apply is up to you -- I prefer different curves depending on the listening volume -- louder listening for me necessitates a steeper HF shelving.
Also check the ff. thread: https://www.audiosciencereview.com/forum/index.php?threads/room-eq-faq.28684/
Last edited:
When we use FDW, how do we eq the response to have a tilt down response for the room? Do we just use a reasonable FDW and the room response tonality will already be the same as steady state room respons?better to use frequency dependent windowing (FDW)
ernestcarl
Major Contributor
When we use FDW, how do we eq the response to have a tilt down response for the room? Do we just use a reasonable FDW and the room response tonality will already be the same as steady state room respons?
For normal listening at home, A tilt down is desirable. How much depends in many variables e.g. your listening volume, the playback clarity achieved with the currently used speakers and room acoustics, directivity performance of the monitors... and is the particular record mastered too bright? some movies where the dialogue is not so clear I prefer to keep the HF much more flat or linear... so on and so forth. I personally have several DSP presets saved which I am able to cycle around -- sorry, but I don't think there is a universally "best target curve" out there. Just use or modify a pre-made one or create your own, or maybe modify a "flat" one into a "house curve" within REW:
*also try the "Generate measurement from target shape" button.
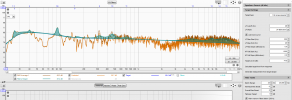
With FDW, the result depends in the early-to-late energy recorded in the room -- this is very room dependent. The ideal windowing in the low frequencies is not the same as in the high frequencies, for example. If you window out (or discard) too much of the lows which may be playing later in time (see the wavelet spectrogram), it would in turn appear attenuated in the resulting frequency magnitude graph:
note trace#3 (of lower set).
These are from two different sets of measurements (different rooms and speaker types). Mine (2-way coaxial single L+R vector avg) are the wider bandwidth traces augmented with a sub -- room is more "dead" and IR behavior is closer to minimum phase already by default. The lower set is from @fluid's unequalized? line array (average of 18 measurements) -- see the massive dip in the lows?
Actually, you do see a small dip occurring below 20Hz in the LR vector avg (trace#9) with FDW of 5 cycles applied in mine, too, as I have not bothered correcting the time in the lowest bass frequencies -- excessive FIR taps is needed.
Last edited:
@ernestcarl Thank you very much for answering. I have been reading your comments a lot and learned a lot. I was thinking normally the room response is determined by steady state response measured in room, which depends on the room and directivity of speaker. Should I eq the speaker to anechoicly flat then put in room, or use some target curve you prvided from your link? The target curves seem to boost the bass, except for Dr Toole's curve. Is that bass boost equal flat anechoic speaker out in room, or flat anechoic with bass boost?
At 20 Hz one cycle is 50ms, 5 cycles will be 250ms. Is it really caused by too narrow gating? I am not experts in definition of different graphs, but I remember CSD is not reliable at low frequency because CSD is gated, what about wavelet spectrogram? Is there a graph that looks like CSD but without any gating?Actually, you do see a small dip occurring below 20Hz in the LR vector avg (trace#9) with FDW of 5 cycles applied in mine, too, as I have not bothered correcting the time in the lowest bass frequencies -- excessive FIR taps is needed.
ernestcarl
Major Contributor
Should I eq the speaker to anechoicly flat then put in room, or use some target curve you prvided from your link? The target curves seem to boost the bass, except for Dr Toole's curve. Is that bass boost equal flat anechoic speaker out in room, or flat anechoic with bass boost?
If you have the Listening Window (LW) and anechoic on- and off-axis curves of your speakers, you should use those as additional reference for applying speaker EQ. If you don't have those, you can use a moving microphone measurement(s). It doesn't have to be equalized completely flat as long as you are able to make it more linear and smooth. The amount of tilt on either end of the curve is up to you (also depends if it's an RMS avg, vector avg, MMM, single or summed -- though, I probably would try not to deviate too much from the natural response of the speakers in the room -- assuming the speakers are already linear enough (anechoically) to start with.
At 20 Hz one cycle is 50ms, 5 cycles will be 250ms. Is it really caused by too narrow gating? I am not experts in definition of different graphs, but I remember CSD is not reliable at low frequency because CSD is gated, what about wavelet spectrogram? Is there a graph that looks like CSD but without any gating?
You can change the parameters for most of the views that include a time component -- e.g. GD, decay, waterfall, spectrogram.
I'm no expert myself (and generally do not bother with the math), but some of these graphical views are rather intuitive enough -- it just takes some getting used to "reading" or interpreting them.
example Wavelet and freq magnitude graphs:
*Dips in the windowed response correspond to delayed energy arriving at the microphone position.
The two curves are derived from a single left and right average:
1. Green is an RMS average (magnitude information only) where I artificially generated a "minimum phase" response (essentially there is effectively no time delay).
2. Red trace is a vector average where the original time information from the impulse responses are included in the summed/averaged result.
"Artificially" generated minimum phase version wavelet of the RMS avg; and magnitude traces without any windowing:
The higher wavelet resolution (1/24) I used emphasizes the frequency magnitude component of the IR.
We see that some of the decrease between 150-400 Hz is caused by the (room induced) phase difference between the vector averaged, surround left and right (SLR) channels.
We can see some of this information already repeated in the overlayed group delay graph:
Right now, I really don't know what windowing works best... but it's kind of a case to case thing as well. I just cycle though different settings. However, in the low bass, I generally do not feel the need to apply any kind of smoothing or windowing at all.
*Also Attached the MDAT file for reference.
Attachments
Last edited:
Similar threads
- Replies
- 5
- Views
- 552
- Replies
- 1
- Views
- 719
- Replies
- 4
- Views
- 586
- Replies
- 16
- Views
- 3K
- Replies
- 45
- Views
- 5K