• WANTED: Happy members who like to discuss audio and other topics related to our interest. Desire to learn and share knowledge of science required. There are many reviews of audio hardware and expert members to help answer your questions. Click here to have your audio equipment measured for free!

Signal to noise ratio for loudspeakers?

YSDR

Senior Member
Joined
Sep 5, 2019
Messages
300
Likes
310
Why there are no signal to noise ratio measurements for loudspeakers? They don't produce their own noise, so don't need to measure? They are mechanical devices, so there must be some noise if they works. Yeah, probably different than an amplifier noise floor for example, because amps (or other electronics) produces noise even if they don't play any sound, just turned on.
Sorry if this is a silly question!
 

solderdude

Grand Contributor
Joined
Jul 21, 2018
Messages
16,053
Likes
36,439
Location
The Neitherlands
No signal = no cone movement = no emitted sound = no noise.

There are S/N ratios for active speakers though but that is the amplifier (electronics) and not the actual driver(s) itself.
Speakers do distort, in other words not output exactly what has been applied, but this is not noise which is random.
 
OP
Y

YSDR

Senior Member
Joined
Sep 5, 2019
Messages
300
Likes
310
I mean, if they move, there must be some kind of mechanical noise. As I said, this will be different noise than an amp's noise, because if the cone assembly doesn't move, then produced noise by the speaker is zero of course.
 

sergeauckland

Major Contributor
Forum Donor
Joined
Mar 16, 2016
Messages
3,460
Likes
9,163
Location
Suffolk UK
I mean, if they move, there must be some kind of mechanical noise. As I said, this will be different noise than an amp's noise, because if the cone assembly doesn't move, then produced noise by the speaker is zero of course.
I understand what you mean. When a loudspeaker is unenergised, then clearly the cone(s) don't move, so no noise, but when the cones are moving, then there has to be some mechanical noise from the cones not due to the amplifier.

This noise will show up in the distortion spectrum, as a raising in the noise floor, as the noise is not harmonically related to the sound being produced or the harmonic distortion created by the loudspeaker.

However, this noise floor will be indistinguishable from the ambient noise floor in the measuring room,, including amplifier noise, which can be very low in an anechoic chamber, but not zero. In an ordinary room such as Kippel measurements are made, noise will be a lot higher as Kippel and similar measurement methods eliminate the room by analysis software means. Hence I don't see how it could be measured with any degree of accuracy.

In practice, I have never heard any suggestion of it being a problem, and if it were, presumably(!) someone would have noticed the noise floor being modulated.

Interesting question, however.

S
 

Fluffy

Addicted to Fun and Learning
Joined
Sep 14, 2019
Messages
856
Likes
1,426
We need some definitions here. Noise is commonly defined as adding random tone components that aren't dependent on the signal. Distortion as adding unwanted harmonics that are dependent on the signal. Besides that, you have hums and resonances (and other such disturbances), that are added tones that aren't random, but also aren't dependent on the signal.

As per this definition, noise is created by an electrical component producing random voltage fluctuations because of its imperfections. Since a speaker doesn't produce any voltage on its own, it can't produce random voltage fluctuations. So speakers don't produce noise, but they can produce distortions when their drivers don't replicate perfectly the signal that is sent to them. And they can produce resonances when either the driver or any part of the cabin vibrates in a constructive manner in response to a physical stimulation (such as the driver itself moving).

What is more commonly talked about is the THD percentage of a speaker – the ratio between how much clean signal and how much added unwanted harmonics it produces.
 

AnalogSteph

Major Contributor
Joined
Nov 6, 2018
Messages
3,393
Likes
3,341
Location
.de
As a rule of thumb, when speakers start making mechanical noises they are defective. Voice coil rub / buzz, for example.

While it is certainly plausible that the surround would make some sort of noise as it deforms, it is usually made out of of materials such a butyl rubber, which aren't exactly very noisy to begin with.

The thermal noise of an 8 ohm speaker in the audible bandwidth is about 155 dB below 2.83 V level. Suffice it to say, it is safely inaudible. In headphone terms, we're 146 dB below 1 mW. Still >30 dB below 0 dB SPL even with the most sensitive ones.

While we have about a million distortion mechanisms in speakers to deal with, it seems safe to say that noise isn't an issue. That's something to worry about on the other end of the recording chain.
 

Wombat

Master Contributor
Joined
Nov 5, 2017
Messages
6,722
Likes
6,464
Location
Australia
There is unwanted sound radiating from inside the cabinet via the speaker cone(s), ports/vents and the cabinet surfaces.
 

Blumlein 88

Grand Contributor
Forum Donor
Joined
Feb 23, 2016
Messages
20,771
Likes
37,635
Other than rub or buzz from defects, I'd imagine there has to be noise.

Now it is likely below the noise floor of your room, and maybe even below the noise floor of the amp. You could use REW. Measure noise without the speaker playing, then play a test tone. See how the noise floor changes. But I think other than harmonics of the tone you'll not see much other than your room noise floor.
 

andreasmaaan

Master Contributor
Forum Donor
Joined
Jun 19, 2018
Messages
6,652
Likes
9,406
"Noise" (or rather noises) from voice coil/cone/suspension movement is not noise strictly speaking, since it is signal dependent (it only appears when the voice coil is displaced, and this displacement is caused by the applied signal).
 

JohnYang1997

Master Contributor
Technical Expert
Audio Company
Joined
Dec 28, 2018
Messages
7,175
Likes
18,300
Location
China
Actually in some ways... there's noise modulation that can be measured by notching out the harmonics.
 

Head_Unit

Major Contributor
Forum Donor
Joined
Aug 27, 2018
Messages
1,361
Likes
721
I mean, if they move, there must be some kind of mechanical noise. As I said, this will be different noise than an amp's noise, because if the cone assembly doesn't move, then produced noise by the speaker is zero of course.
I guess the answer to your question is that noise in electronics is usually thought of as something everpresent even with no audio, like random thermal noise or crosstalk or power supply harmonics leaking into the signal. Changes to the audio are generally thought of as distortion.

Hence, mechanical sounds emitted by a playing speaker from its moving parts would be considered as distortion. And oh yes there CAN be mechanical noise, even below physical limits. I had to fly all the way to the Phillipines once to work on reducing noise coming out of a pole piece vent! You can have buzzing voice coil leads, air trapped under spiders, all kinds of stuff. Audible in free air tone sweeps, far less so usually once the speaker is in an enclosure.
 

tuga

Major Contributor
Joined
Feb 5, 2020
Messages
3,984
Likes
4,285
Location
Oxford, England
I like the concept of "box boof" put forward by Hi-Fi World:


DECAY SPECTRUM

WHAT IT TELLS US
The idea behind this measurement is to fire a short signal at a loudspeaker and see what emerges when it stops. Ideally, there should be nothing. In practice, energy bouncing around inside the cabinet and stored in mechanical reactance within resonant systems dissipates, out through the cone(s) and cabinet walls and port, producing a decaying signal. This isn’t wanted, as it muddies the sound and colours it.
Measurement of spectral decay (waterfall plot) produces a large amount of complex data in a pretty picture that looks impressive but is difficult to interpret. Unlike frequency response there is no agreed and commonly used methodology behind this measurement. We use this test to look at perceptibly obvious colouration, such as box ‘boof’, rather than the intrinsic character of a drive unit, for example. Consequently we use a decay time outside the 20-30mS boundary between intrinsic colour and a divorced echo or colouration, such as box 'boof’. At present, after experiment across a large sample of loudspeakers under test for review, we use 200mS for a useful picture. For similar reasons International Audio Group (Quad, Mission, Wharfedale, Castle and Leak brands) use 500mS (half a second) decay time. Many published waterfall decay plots, however, show a short time window of 20mS or less, inside the Intrinsic / Divorced boundary. These attempt to reveal intrinsic drive unit colouration and are not comparable to our data.
Ideally, there will be no time delayed information but in practice long decays, seen as ranges of descending hills, exist and are evidence of colouration. The undamped glass cabinet of Waterfall's Victoria Evo loudspeaker (above) clearly illustrates this. Often, a colouration seen in this plot can be linked to a small perturbation in our green frequency response plot, and greater disturbance in our red port plot,indicating a strong internal box mode exists. This not uncommon phenomenon, revealed by a spectral decay plot, can be heard as slight chestiness and boxy colour to deep male speech on the radio, where live talk direct to the microphone provides a stringent real life test signal. So spectral decay analysis can be useful, especially when it helps identify a problem seen less obviously within other measurements.


HOW WE MEASURE IT
We fire a test signal known as a ‘log chirp’ (short, fast gliding sine wave burst) through the loudspeaker, as this gives strong low frequency excitation and good signal-to-noise ratio (unlike mls noise). Decay over 200mS (0.2sec) afterward is analysed, depicted as a waterfall plot and as a contour-coloured map. The latter looks at the waterfall from above and uses colour to identify different levels, much like an Ordnance Survey map. Correlation between the two display methods is shown clearly, where the 'hills' in the waterfall are seen as streaks of colour in the contoured map. Highest levels are Red (hot) and Lowest are Blue (cold), running through the colour spectrum between. This is visually easily assimilated and quite powerful once understood. The data is referred to, but not published in the magazine, to save space.


http://www.hi-fiworld.co.uk/index.php/loudspeakers/69-tests/95-decay-spectrum-waterfall.html

graham-audio-ls5-9-decay-gr.gif

Graham Audio BBC LS5/9 (review source)
(thin-wall "lossy" cabinet construction)
graham-audio-ls5-9-decay-ma.gif


--------------------------------------------------------------------

usher-dancer-minix-decaygra.jpg

Usher Dancer Mini-X Diamond (review source)
(thick 50mm baffle, 25mm curved walls cabinet construction)
usher-dancer-minix-decaymap.jpg
 
Last edited:

Rusty Shackleford

Active Member
Joined
May 16, 2018
Messages
255
Likes
550
I like the concept of "box boof" put forward by Hi-Fi World:


DECAY SPECTRUM

WHAT IT TELLS US
The idea behind this measurement is to fire a short signal at a loudspeaker and see what emerges when it stops. Ideally, there should be nothing. In practice, energy bouncing around inside the cabinet and stored in mechanical reactance within resonant systems dissipates, out through the cone(s) and cabinet walls and port, producing a decaying signal. This isn’t wanted, as it muddies the sound and colours it.
Measurement of spectral decay (waterfall plot) produces a large amount of complex data in a pretty picture that looks impressive but is difficult to interpret. Unlike frequency response there is no agreed and commonly used methodology behind this measurement. We use this test to look at perceptibly obvious colouration, such as box ‘boof’, rather than the intrinsic character of a drive unit, for example. Consequently we use a decay time outside the 20-30mS boundary between intrinsic colour and a divorced echo or colouration, such as box 'boof’. At present, after experiment across a large sample of loudspeakers under test for review, we use 200mS for a useful picture. For similar reasons International Audio Group (Quad, Mission, Wharfedale, Castle and Leak brands) use 500mS (half a second) decay time. Many published waterfall decay plots, however, show a short time window of 20mS or less, inside the Intrinsic / Divorced boundary. These attempt to reveal intrinsic drive unit colouration and are not comparable to our data.
Ideally, there will be no time delayed information but in practice long decays, seen as ranges of descending hills, exist and are evidence of colouration. The undamped glass cabinet of Waterfall's Victoria Evo loudspeaker (above) clearly illustrates this. Often, a colouration seen in this plot can be linked to a small perturbation in our green frequency response plot, and greater disturbance in our red port plot,indicating a strong internal box mode exists. This not uncommon phenomenon, revealed by a spectral decay plot, can be heard as slight chestiness and boxy colour to deep male speech on the radio, where live talk direct to the microphone provides a stringent real life test signal. So spectral decay analysis can be useful, especially when it helps identify a problem seen less obviously within other measurements.


HOW WE MEASURE IT
We fire a test signal known as a ‘log chirp’ (short, fast gliding sine wave burst) through the loudspeaker, as this gives strong low frequency excitation and good signal-to-noise ratio (unlike mls noise). Decay over 200mS (0.2sec) afterward is analysed, depicted as a waterfall plot and as a contour-coloured map. The latter looks at the waterfall from above and uses colour to identify different levels, much like an Ordnance Survey map. Correlation between the two display methods is shown clearly, where the 'hills' in the waterfall are seen as streaks of colour in the contoured map. Highest levels are Red (hot) and Lowest are Blue (cold), running through the colour spectrum between. This is visually easily assimilated and quite powerful once understood. The data is referred to, but not published in the magazine, to save space.


http://www.hi-fiworld.co.uk/index.php/loudspeakers/69-tests/95-decay-spectrum-waterfall.html

graham-audio-ls5-9-decay-gr.gif

Graham Audio BBC LS5/9 (review source)
(thin-wall resonant cabinet construction)
graham-audio-ls5-9-decay-ma.gif


--------------------------------------------------------------------

usher-dancer-minix-decaygra.jpg

Usher Dancer Mini-X Diamond (review source)
(thick 50mm baffle, 25mm curved walls cabinet construction)
usher-dancer-minix-decaymap.jpg

Can you explain more what you’re looking for here? Is the Usher the good or bad example, or are they both bad?
 

tuga

Major Contributor
Joined
Feb 5, 2020
Messages
3,984
Likes
4,285
Location
Oxford, England
Can you explain more what you’re looking for here? Is the Usher the good or bad example, or are they both bad?

In the coloured graph a perfect cabinet would show a red line quickly turning green (-10dB) then cyan (-30db) then blue (-40dB) then going silent black.

The Graham BBC cabinet goes quiet faster than the Usher above ~200Hz, as can be seen in the waterfall/CSD plot where the first line is the sweep at full scale/volume and ensuing lines the response of the speaker over time as it stops resonating.
 

Rusty Shackleford

Active Member
Joined
May 16, 2018
Messages
255
Likes
550
In the coloured graph a perfect cabinet would show a red line quickly turning green (-10dB) then cyan (-30db) then blue (-40dB) then going silent black.

The Graham BBC cabinet goes quiet faster than the Usher above ~200Hz, as can be seen in the waterfall/CSD plot where the first line is the sweep at full scale/volume and ensuing lines the response of the speaker over time as it stops resonating.

In the linked review, the measurer praises the Usher’s measurements, including the waterfall specifically: “There is no upper mid-range crossover suckout so detailing will be strong. There is no bass lift either, to add warmth or body to the sound. Absence of peaks and undulations in frequency response suggest low coloration and this was borne out by our 200mS decay analysis.”

So I wonder if it’s actually a poor example.
 
Last edited:

Head_Unit

Major Contributor
Forum Donor
Joined
Aug 27, 2018
Messages
1,361
Likes
721
The Graham BBC cabinet goes quiet faster than the Usher above ~200Hz...
Yeah, it's interesting. The thin resonant walls are typically thought of as inferior to huge thick ones-but maybe the Graham "gets it over with" faster. I'd like to see more measurements like this. And maybe it's more about bracing and/or damping than sheer mass/thickness. (Shhh, don't tell Wilson and their customers, they'll drop dead of a heart attack ha ha)
 

tuga

Major Contributor
Joined
Feb 5, 2020
Messages
3,984
Likes
4,285
Location
Oxford, England
Yeah, it's interesting. The thin resonant walls are typically thought of as inferior to huge thick ones-but maybe the Graham "gets it over with" faster. I'd like to see more measurements like this. And maybe it's more about bracing and/or damping than sheer mass/thickness. (Shhh, don't tell Wilson and their customers, they'll drop dead of a heart attack ha ha)

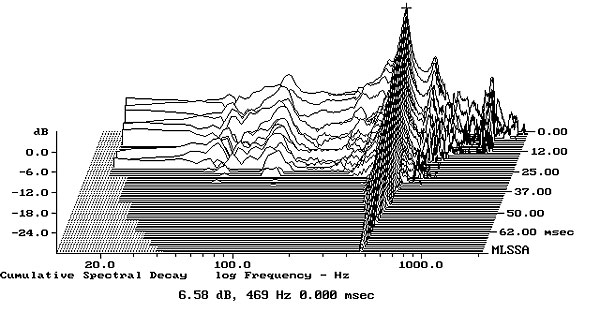
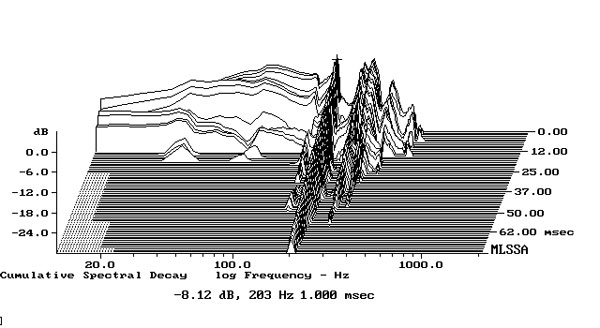
This CSD is from the Wilson Duette 2 (8" mid-woofer 2-way standmount):

315WD2fig2.jpg

https://www.stereophile.com/content...ties-duette-series-2-loudspeaker-measurements


This one from a Harbeth M30.2 (8" mid-woofer 2-way standmount), a half-brother of the Graham BBC LS5/9:

318harbeth.H302fig2.jpg

https://www.stereophile.com/content...-anniversary-edition-loudspeaker-measurements


This is the loudness contour curve indicating ear sensitivity vs. frequency:

400px-Lindos1.svg.png


It looks like the BBC cabinet is quiet(er) where it matters most (silent above 500Hz).
 
Top Bottom