ernestcarl
Major Contributor
Hey everyone, I thought as my first post on the forum I'll share some in room measurements I just took.
This might be of interest since I know there is some interest in ME-Geithain speakers here, but not much data to discuss.
Anyway, the measurements are taken in the living room music/tv setup with a RME-ADI-2 DAC going into a PAS 2002PCA Amp which feeds a Pair of Geithain ME25s. So the simple 5" bookshelf, the smallest and cheapest speakers from their line-up. Main reason for the measurements was to develop a 5 band EQ for the adi.
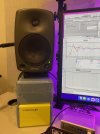
Measurements are an average of 5 measurement points around the main listening position executed with an Earthworks M23 into my RME Babyface. Some time ago i calibrated this measurement chain with a proper calibrator (Larson Davis CAL200) at my workplace, so also the absolute level should be reasonably accurate (but definitely not class 1, since calibration was some time ago and with different temperature).
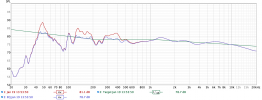
First set of data is the averaged frequency response at the MLP with psychoacoustic smoothing, comparing without and with EQ, averaged for both speakers.
View attachment 179722
The room has minimal acoustic treatment (one low-mid frequency trap in a corner) and normal furniture for a living room. I think out of the box the resonse is OK and most of the filtering I implemented was to optimize the low-mids. What I find curious is the small wide-Q peak centered around 4 kHz. I recall Mr. Kiesler saying, that he thinks speakers should have a wider radiation around 4 kHz, since our ears tend to rate the direct sound at those frequencies higher compared to the reflected sound and thus, speakers without a widened 4 kHz dispersion will sound too close and present: German_Interview_MEGeithain.
So that small peak seems to stem from a neutral on-axis with wide dispersion at 4kHz, but to say for sure further measurements would be necessary. Interestingly enough I found the sound to be more pleasing with the peak knocked down a bit.
Let's have a closer look at the response:
View attachment 179731
This time 1/12th octave smoothing and individual responses for both speakers. Biggest take-aways for me: the left speaker definetely suffers from sitting in an actual bookshelf, compared to the right speaker, which is stitting on a proper stand. The low-mid dips and peaks are more pronounced on the left speaker. And the next thing: the REW Roomsim has a reasonable correlation for the lowest frequencies, but from above ~ 100 Hz, where the absorber and the furniture start to absorb some energy, the actual measured response looks a bit better than the simulation. I didn't find a way to implement frequency dependent absorption in the REW roomsim, which would make it a really(!) powerfull tool.
One last bit of information I wan't to drop: I can't easily take free-field measurements of the speakers, but I tried to measure the distortion profile. Measurement was taken at 31,6 cm from the grille, the level was already compensated to 1 m in the attatched figures. I set the level to be around 90 dB to compare to the company specs and found a reasonable correlation. Btw. is there an easy way to have REW display distortion % with linear y-Axis? I didn't find the time to export and plot with other software.
View attachment 179733View attachment 179734
Cheers.
The 3-5 kHz bump isn’t present in their own 0 and 30 degree graphs. Could be just from your own room? A wider moving microphone measurement (0-30 degree spread) would be interesting to contrast with the single point sweeps.

")