• WANTED: Happy members who like to discuss audio and other topics related to our interest. Desire to learn and share knowledge of science required. There are many reviews of audio hardware and expert members to help answer your questions. Click here to have your audio equipment measured for free!

Share your in-room measurements?

ernestcarl

Major Contributor
Joined
Sep 4, 2019
Messages
3,113
Likes
2,330
Location
Canada
Hey everyone, I thought as my first post on the forum I'll share some in room measurements I just took.
This might be of interest since I know there is some interest in ME-Geithain speakers here, but not much data to discuss.
Anyway, the measurements are taken in the living room music/tv setup with a RME-ADI-2 DAC going into a PAS 2002PCA Amp which feeds a Pair of Geithain ME25s. So the simple 5" bookshelf, the smallest and cheapest speakers from their line-up. Main reason for the measurements was to develop a 5 band EQ for the adi.

Measurements are an average of 5 measurement points around the main listening position executed with an Earthworks M23 into my RME Babyface. Some time ago i calibrated this measurement chain with a proper calibrator (Larson Davis CAL200) at my workplace, so also the absolute level should be reasonably accurate (but definitely not class 1, since calibration was some time ago and with different temperature).

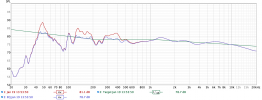
First set of data is the averaged frequency response at the MLP with psychoacoustic smoothing, comparing without and with EQ, averaged for both speakers.
View attachment 179722

The room has minimal acoustic treatment (one low-mid frequency trap in a corner) and normal furniture for a living room. I think out of the box the resonse is OK and most of the filtering I implemented was to optimize the low-mids. What I find curious is the small wide-Q peak centered around 4 kHz. I recall Mr. Kiesler saying, that he thinks speakers should have a wider radiation around 4 kHz, since our ears tend to rate the direct sound at those frequencies higher compared to the reflected sound and thus, speakers without a widened 4 kHz dispersion will sound too close and present: German_Interview_MEGeithain.
So that small peak seems to stem from a neutral on-axis with wide dispersion at 4kHz, but to say for sure further measurements would be necessary. Interestingly enough I found the sound to be more pleasing with the peak knocked down a bit.

Let's have a closer look at the response:
View attachment 179731
This time 1/12th octave smoothing and individual responses for both speakers. Biggest take-aways for me: the left speaker definetely suffers from sitting in an actual bookshelf, compared to the right speaker, which is stitting on a proper stand. The low-mid dips and peaks are more pronounced on the left speaker. And the next thing: the REW Roomsim has a reasonable correlation for the lowest frequencies, but from above ~ 100 Hz, where the absorber and the furniture start to absorb some energy, the actual measured response looks a bit better than the simulation. I didn't find a way to implement frequency dependent absorption in the REW roomsim, which would make it a really(!) powerfull tool.

One last bit of information I wan't to drop: I can't easily take free-field measurements of the speakers, but I tried to measure the distortion profile. Measurement was taken at 31,6 cm from the grille, the level was already compensated to 1 m in the attatched figures. I set the level to be around 90 dB to compare to the company specs and found a reasonable correlation. Btw. is there an easy way to have REW display distortion % with linear y-Axis? I didn't find the time to export and plot with other software.
View attachment 179733View attachment 179734

Cheers.

The 3-5 kHz bump isn’t present in their own 0 and 30 degree graphs. Could be just from your own room? A wider moving microphone measurement (0-30 degree spread) would be interesting to contrast with the single point sweeps.
 
Joined
May 5, 2018
Messages
88
Likes
52
Went through the DIRAC measurement process. This is a MMM with the resultant filters. I turned all the analog signal processing off on the 8030s and 1092s. Set the sub to 0 dBu, and removed the bass roll-off.
2022_01_17 MMM wDIRAC.png
 

Erici

Active Member
Forum Donor
Joined
Jun 17, 2020
Messages
181
Likes
293
Location
Seattle Area
Went through the DIRAC measurement process. This is a MMM with the resultant filters. I turned all the analog signal processing off on the 8030s and 1092s. Set the sub to 0 dBu, and removed the bass roll-off.View attachment 179752
Big improvement! This might sound a bit bright, but if it does you can modify the Dirac target curve to reduce the highs. Search on ASR for target curves or use the link below.


Reibekaese

New Member
Joined
Jan 17, 2022
Messages
4
Likes
6
Location
Germany
The 3-5 kHz bump isn’t present in their own 0 and 30 degree graphs. Could be just from your own room? A wider moving microphone measurement (0-30 degree spread) would be interesting to contrast with the single point sweeps.
That's true and still a bit puzzling to me. If I find the time for more measurements, I'll report back ;)
 
Joined
May 5, 2018
Messages
88
Likes
52
Big improvement! This might sound a bit bright, but if it does you can modify the Dirac target curve to reduce the highs. Search on ASR for target curves or use the link below.

So, a couple things. I've had a nagging feeling that I wasn't getting a center image (always felt a little left to me). DIRAC measurements confirmed this was the case and applied a -0.7dB gain adjustment a .2ms delay. Much better. I tried a couple of the curves in that thread linked above. All of them sound like WAY too much bass to me. I did like the "Toole in India Flat", which has 2.1 dB at 20 Hz, 0.0 dB at 1 kHz and -1.6 dB at 10 kHz. I need to listen more.

Will listen this evening and take some more measurements tomorrow if I have some time.
 
Joined
May 5, 2018
Messages
88
Likes
52
I experimented with putting the speakers on blocks to raise them up 8" and get them off the desk. This gets them up at ear level.

This is an updated MMM with LR sum, which seems to reflect more what I am hearing. It has plenty of bass. There is that big depression still between 50-90 Hz, but I think the overall shape is closer to a target curve.

I have Dirac turned off for this. And just have a couple of cuts below 500 Hz. I need to try Dirac measurement next.
 

Attachments

  • 2022_01_19 MMM LR 8030 1092 on Blocks.png
    2022_01_19 MMM LR 8030 1092 on Blocks.png
    95.9 KB · Views: 113
  • IMG_8487.jpeg
    IMG_8487.jpeg
    321.4 KB · Views: 105

MCH

Major Contributor
Joined
Apr 10, 2021
Messages
2,659
Likes
2,273
Hello guys,
After receiving your valuable advices here (original post #512) I went ahead and tried to improve my eq manually doing measure/adjust iterations and here is where I am now (red and green my current R L measurements, brown the original averaged measurement without correction). Note that I did not change anything above ca 300 Hz except the low shelf.

What do you guys think? What should I be doing next if anything?

1642769131750.png

*note: Don't know why the scale of the recordings (made with audacity) is now much higher than the original recordings made with rew. I think the volume was roughly the same. In any case, if not relevant I don't worry about that
 

Steve Dallas

Major Contributor
Joined
May 28, 2020
Messages
1,217
Likes
2,926
Location
A Whole Other Country
Hello guys,
After receiving your valuable advices here (original post #512) I went ahead and tried to improve my eq manually doing measure/adjust iterations and here is where I am now (red and green my current R L measurements, brown the original averaged measurement without correction). Note that I did not change anything above ca 300 Hz except the low shelf.

What do you guys think? What should I be doing next if anything?

View attachment 180743
*note: Don't know why the scale of the recordings (made with audacity) is now much higher than the original recordings made with rew. I think the volume was roughly the same. In any case, if not relevant I don't worry about that

Do you mind changing the scale to our 50dB standard and re-posting?

The roll-off from 1KHz up looks drastic to me, but I would like to see it with the correct scale. Otherwise, that looks like a good result.

Feel free to post the original and resultant MDAT files for us to play around with.
 
Last edited:

MCH

Major Contributor
Joined
Apr 10, 2021
Messages
2,659
Likes
2,273
There you go
(seems it is not possible to upload the mdat files)
1642776889862.png
 
Last edited:

Erici

Active Member
Forum Donor
Joined
Jun 17, 2020
Messages
181
Likes
293
Location
Seattle Area
There you go
(seems it is not possible to upload the mdat files)
View attachment 180765
As Steve noted, the 20 dB drop from 1000 hz to 20K hz still looks unusual. It's probably a measurement error.
If you're using the MMM approach, it could be caused by the mode setting being spectrum versus RTA 1/48.
The drop could also be from not using a calibrated measurement mic. Can you tell us about your measurement setup?
 

MCH

Major Contributor
Joined
Apr 10, 2021
Messages
2,659
Likes
2,273
As Steve noted, the 20 dB drop from 1000 hz to 20K hz still looks unusual. It's probably a measurement error.
If you're using the MMM approach, it could be caused by the mode setting being spectrum versus RTA 1/48.
The drop could also be from not using a calibrated measurement mic. Can you tell us about your measurement setup?
Sure, i use an umik-1 with its calibration file. To record the frequency sweep with the eq (the graphs you are seeing), i do it with the same umik-1. When i import the recording to REW i do select "use calibration file".
I do have a filter for the high frequencies that is probably wrong (?), looks like this (number10, sorry for the bad picture):
16428048939016941372373459699433.jpg
 

Erici

Active Member
Forum Donor
Joined
Jun 17, 2020
Messages
181
Likes
293
Location
Seattle Area
Sure, i use an umik-1 with its calibration file. To record the frequency sweep with the eq (the graphs you are seeing), i do it with the same umik-1. When i import the recording to REW i do select "use calibration file".
I do have a filter for the high frequencies that is probably wrong (?), looks like this (number10, sorry for the bad picture):
View attachment 180866
Well, I think that explains the high frequency dropoff. A more typical inroom slope is around 6-8 dB from 100 to 20000.
Could you remeasure and repost without any EQ?
 

MCH

Major Contributor
Joined
Apr 10, 2021
Messages
2,659
Likes
2,273
Well, I think that explains the high frequency dropoff. A more typical inroom slope is around 6-8 dB from 100 to 20000.
Could you remeasure and repost without any EQ?
Without any eq is the brown line in post #548. Could you explain what exactly would you input in rew (instead of line 10) to obtain such slope? If it wasn't clear enough: Complete newbie here :D
 
Last edited:

MCH

Major Contributor
Joined
Apr 10, 2021
Messages
2,659
Likes
2,273
If you compress the .mdat, you can post.
Thanks for the tip! Here they are. It contains the averaged measurements I made initially with no eq (average of 3 measurements made from slightly different positions of a couch facing the speakers) plus the measurements made with audacity of the EQd sweep R and L channels. That is, the brown, green and red lines posted above). All recorded with the same umik-1.
 

Attachments

  • mdat.zip
    2.8 MB · Views: 57

sharock

Active Member
Joined
Feb 9, 2021
Messages
267
Likes
287
I'd like to post a couple of MMMs I've made. What is the correct way to scale the graphs in REW? I've got an ultrawide monitor so they seem to be either too stretched full screen or too compressed half-screened.

Edit: Thanks Eetu.

Here are the measurements for my TV setup and desktop setup respectively. Both measurements are 1/6 smoothed, post-Dirac correction (default target) and seem to be the best I can get in my room without any treatment and limited positioning options.

TV - Elac Navis ARF-51 + SVS SB4000

Not that happy below 500Hz. Nulls at 30Hz and 85Hz. Seems to be a big suckout between 150-400Hz. I've tried moving the speakers closer and further from the front wall. Nothing seems to change. My space is a bit cluttered around the speakers.

navis_mmm.png


Desktop - Genelec 8030c + SVS SB1000 Pro

Again, problematic below 500Hz. I've tried moving/rotating the sub but there aren't many options for repositioning.

8030c_mmm.png
 
Last edited:

Eetu

Addicted to Fun and Learning
Forum Donor
Joined
Mar 11, 2020
Messages
763
Likes
1,180
Location
Helsinki
I'd like to post a couple of MMMs I've made. What is the correct way to scale the graphs in REW?

I've got an ultrawide monitor so they seem to be either too stretched full screen or too compressed half-screened.
You can use the 'Limits' button to limit the frequency response to 20 - 20000 and Y-axis (SPL) to 50dB, for example 40 - 90 or 50 - 100 dB. You can screenshot then or use the 'Overlays' function to save the graph as a file.
 

Erici

Active Member
Forum Donor
Joined
Jun 17, 2020
Messages
181
Likes
293
Location
Seattle Area
Without any eq is the brown line in post #548. Could you explain what exactly would you input in rew (instead of line 10) to obtain such slope? If it wasn't clear enough: Complete newbie here :D
Sorry I missed your earlier post with the unfiltered FR. It looks normal to me.
I use the EQ function in REW to create my filters. Seems to work very well. REW is very powerful but also can be complex. So it takes some time and energy to get the best results.
Here is a link the best REW primer that I've found. It has a section on the EQ function.
 

bjmsam

Member
Joined
Feb 1, 2022
Messages
41
Likes
21
Location
Mount Airy, MD
Great thread! I used the Audyssey microphone to take measurements today in my HT after replacing a B&K Reference 30 with a Denon AVR-X4000 and completing XT-32 calibration (and fighting with REW on Linux). Below are the graphs I found most interesting.


Audyssey OFF vs. both curves toggling Dynamic EQ

AudMeasurements-20-20k.png


AudMeasurements-10-200.png


AudMeasurements-GD.png


AudMeasurements-RT60.png


AudMeasurements-Clarity.png


So far, I prefer the sound in L/R Bypass mode when Audyssey corrects only the surrounds.

AudMeasurements-Waterfall-20-20k.png

AudMeasurements-Waterfall-10-200.png

AudMeasurements-Spectogram.png


Speaker toe (surprised that no toe is flatter between 3kHz and 12kHz)

ToeMeasurements20-20k.png


ToeMeasurements-Clarity.png


Comb filtering remains a challenge (all measurements taken laterally across width of seat at MLP)

CombFiltering.png


room layout and view from behind the MLP

AM-JKLVBHVo-pW6rl5pXvMhNh25n36XRNq2s-sXNa-Jec0cvEiudEq1YfdYZ9wPTOlk30GLO4fizDAfiMRveRQ33Ow4eB9bmL5AE6HHO4D8XTi9GPRD2Xtz-nn4dPVHPJTLyAzCce7GgbPIdCVO_FOdWFqmJZA=w1117-h978-no


AM-JKLUtI31TmUQFNNImvfG6PX5BdguSL_WDLRyzdesdxtzZ1sQ_m5lXgAG75AHchq8GEojLO8_XJZHfoMjMcEEyLfXiqG6Ex40uKs_T9toDlZyVRbd0K8RiCzGlvZuLK4hlHocnuy35jooXJyrLTv_sVtq-NQ=w1456-h1092-no
 
Last edited:
Top Bottom