What is mostly missing is a tell all measurement. A waterfall plot of a speaker/room with a clear resonance peak before and after EQ.
Waterfall plot is still a result of Fourier transform (just sampled at specific timeframes and drawn in 3D) so it must show the same thing - it is a mathematical necessity. However, given that waterfall plots trade frequency resolution for time resolution (or vice versa) they can sometimes be misleading.
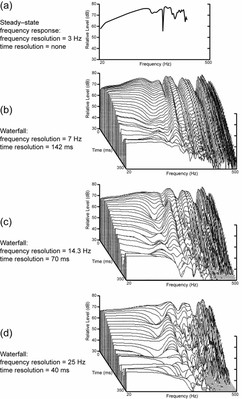
This is actually illustrated in dr. Toole's book as well - see these examples of the same measurement, presented in waterfall form with a few different resolution variants (
link to source with text):
Notice how the plot under (b) has a more precise frequency response shape but makes it seem that resonances never stop ringing in the time domain, while the one under (d) doesn't show precise frequency response shape, but shows that time-domain ringing is not nearly as bad.
Note that all of these are showing exactly the same data - it is just a matter of presentation.
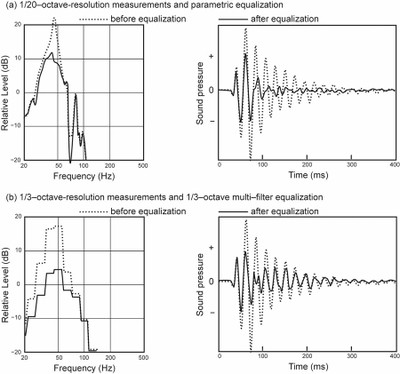
The result I expect would be that if the EQ flattens the response on the crest of the impulse that the resonant frequency will still take longer to decay than the adjacent frequencies. If the decay is relatively uniform then the EQ truly is the magic bullet.
If the frequency domain resonance is completely removed then the associated temporal ringing is removed as well.
Again, note that we can use Fourier transform to
calculate the frequency response from the measured impulse response, and Fourier transform theory explains that resonances in frequency domain and ringing in the time domain are in fact the same thing - just that we can draw it in two different ways.
The measurement you posted from Floyd Toole doesn’t tell us about that. There is no metric on the SPLs in those measurements which is a problem and the unEQed decay time is about 150 milliseconds. I am skeptical that this represents a real substantial resonant peak in the bass region. What bass resonances decay in 150 milliseconds without EQ?
The plot looks fine to me - in the time domain response on the right (un-EQed) we can see there are approx. 5 cycles per 100ms which indicates a frequency of about 50Hz, which in turn corresponds to the peak of the resonance in the frequency response on the left.
150ms will fit 7,5 full cycles of a 50Hz tone (50Hz x 0,15s = 7,5 cycles).
The number of cycles it takes for the ringing to die down will be proportional to how distinct the resonance is in the frequency domain - which is exactly why we need corrective filters that are sharp enough to fix it.