Is it possible to overlay, approximately, the profile of the filter on the AtomicBob's graph to better understand the content that is filtered out in calculations? Or is it too narrow for display purposes?
Last edited:

I was asked to comment on a specific "dynamic range" measurement by Bob Smith (AtomicBob). Specifically, he shows the FFT spectrum of a -60 dB tone and on it, declares a signal to noise ratio of 122 dB. As usual, his charts are impossible to read. So please allow me to annotate them such:
View attachment 13771
As you see, his "FFT meters" are declaring that there is 121+ dB of Signal to noise ratio.
That data directly conflicts what the FFT is actually showing. The mains hum alone is enough to make that difference around 65 dB, not 122 dB. Add up all the other distortions and noise and there is no way we have 122 dB of proper dynamic range.
And no, you can't look at the noise floor of the FFT and measure that difference. FFT noise floor gets artificially lowered based on its parameters (called "FFT gain"). But even if we did, that noise floor is at -160 db so subtracting our -60 dB signal from it, we get 100 dB, not 122.
So what is going on? First, let's look at the same measurement using my Audio Precision analyzer of the same -60 dB signal:
View attachment 13772
We see the same mains contribution at 120 Hz and bunch of harmonic distortion. The dedicated meter in Audio Precision is reporting about 60 dB of dynamic range above our noise and distortion which matches more or less the manual math I performed on AtomicBob's graph. And we can with eye confirm the same. Starting with -60 dB signal, the noise floor would have to be -180 dB for us to get the math and no way can we get there.
The key thing for now is that both of our FFT measurements are producing essentially identical results. So the issue is not the device being tested but what the meters on AtomicBob's graph is saying.
Alas, despite all the shouting that goes on on accuracy and documentation of measurements, we have none here from AtomicBob. The meter says: "USER: DAC SNR Residual Async." Good luck trying to find out what that means.
Fortunately I have used the Prism Sound analyzer and still have the software. So I went in there and found this custom script to make measurements from FFT. This is what it looks like when not minimized as he has done:
View attachment 13773
I know, I know, still makes no sense.But stay with me. What this is trying to do is filter out the tone at 1000 Hz ("band reject"). As with any filter, the bandwidth matters. Here, we are interested in taking out our main tone and look at what is left as our distortion+noise power. Unfortunately, the filter used here by default is improper. It has a wide bandwidth of 1/3 octave instead of just a hertz or two to take out the 1 kHz tone.
Prism Sound help file explains the motivation and problems with it:
View attachment 13774
Yup, the 1/3 octave filtering is there to emulate old analog THD+N meters! It was hard to filter sharply as we can today with our digital signal processing (and much better analog ones too). As they say, using of this method results in "residual components .... to be underestimated." And underestimated it is and hence the reason he is showing much better values than it should.
Lesson here is that custom scripts for making measurements in analyzers need to read and understood. And results confirmed to make sure it passes the smell test. Clearly an FFT that shows noise components just -65 dB below the signal can't have any useful figure out merit of 120+ dB.
Summary
My measurements/FFT spectrum of a -60 dB tone essentially matches AtomicBob's data. That results in SINAD (signal over noise+distortion power) of just 60 dB. The meter used in AtomicBob's graph to derive the Signal to Noise ratio is simply wrong and not configured correctly. We can easily confirm this on his graph as I have shown.
Let me know if you have any questions.
Ah, OK that makes sense.Yea, I think the idea with that measurement is to estimate the 0dbfs noise performance, and not state the dynamic range at -60db.
To be clear, I am not a fan of such dynamic range measurements when they ignore the distortions that are there. The SINAD includes their effects and is a much more proper measure of true dynamic range of the device. From my original review:
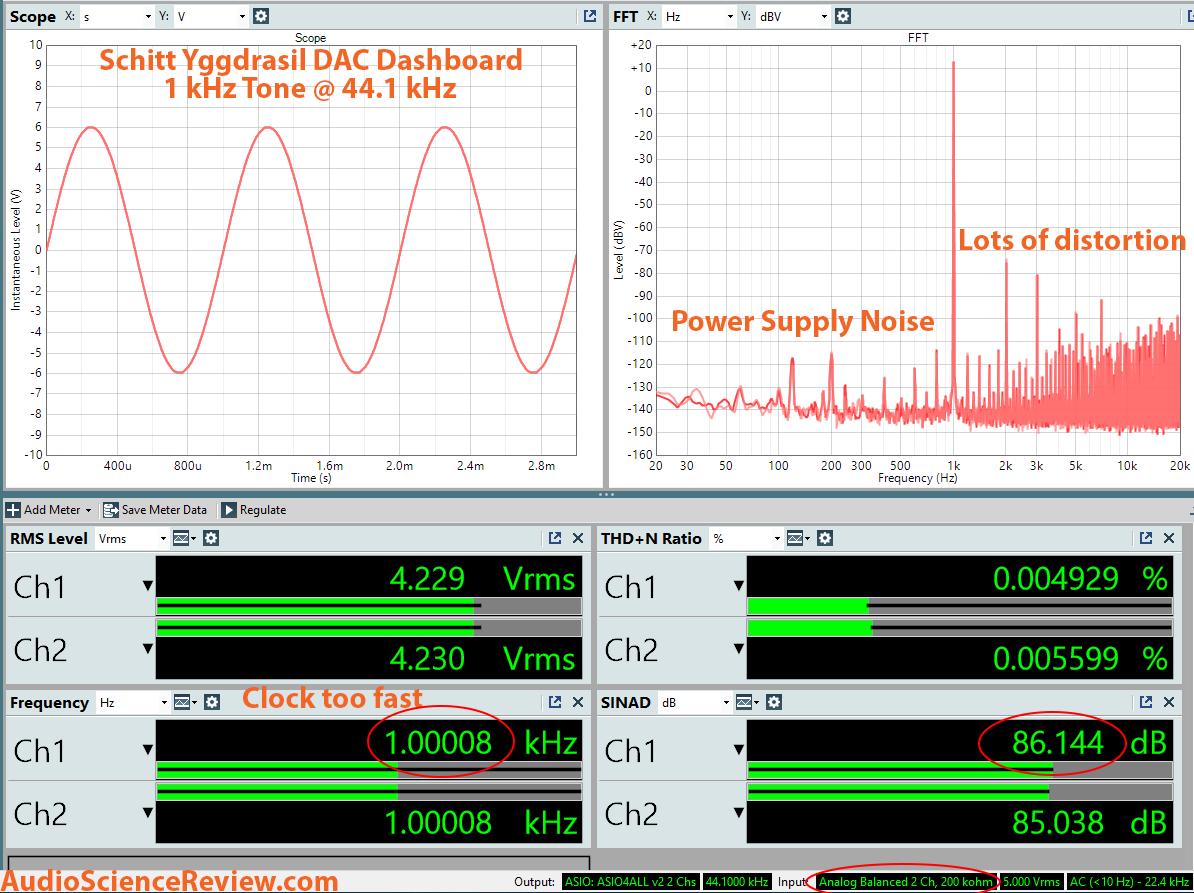
The 86 dB is far more representative of what the DAC is doing than 115 dB I just showed. Audibility of distortion spikes is a lot higher than random noise floor so we better show dynamic range relative to the sum of distortion+noise than noise alone.
That’s what I’d like to see, if for no other reason it gives us something to talk about lolThe nice thing about modern test gear is that it's only a couple of mouse clicks to get both.
Yes, it is actually a good suggestion. Here is what the digital waveform and its spectrum looks like at -120 dBFS and what comes out of Schiit Yggdrasil DAC:Edit: Is there any value in showing the sine wave the AP is inputing compared to the sine wave the DAC is outputting?
As it turns out and I have shown, the difference between the two methods is extremely small. After all, even I filter down -50 dB. The big difference in published reports is due to different units being tested. Clearly what Jude/AtomicBob have is different than what customers have bought. They are either hand-picked or have corrected firmware/design.The nice thing about modern test gear is that it's only a couple of mouse clicks to get both.
Yeh but I have a boat to wash, repair and clean to put in the water!It’s nice to read through these open and honest discussions of our measurements , free from flame throwers, egotism and the like.
I should have finished it all two weeks ago but instead, I am still making Schiit measurements...This is the real story here imo, being obfuscated (possibly intentionally) by ‘measurement wars’.As it turns out and I have shown, the difference between the two methods is extremely small. After all, even I filter down -50 dB. The big difference in published reports is due to different units being tested. Clearly what Jude/AtomicBob have is different than what customers have bought. They are either hand-picked or have corrected firmware/design.
wait, is that unbalanced? because it is a few db worse than the previous -60db sinad measurement you showed if you were to have just added 60db to it. (the 59.940 and 57.168)Here is AES17 canned measurement in Audio Precision then:
Yes, it is actually a good suggestion. Here is what the digital waveform and its spectrum looks like at -120 dBFS and what comes out of Schiit Yggdrasil DAC:
View attachment 13777
The digital sine wave looks a bit noisy because we have added "dither" to it to make it render at such a low amplitude at 24 bits. That results in highly clean spectrum on top right.
In contrast, what is coming out of Schiit DAC below is clearly steppy which means it has truncated digital samples. That truncation causes all the distortion spikes on the right (since the waveform is square, we get odd harmonics of our original tone at 1 kHz). We also have power supply noise on the left.
No.Hmm, wouldn't it be steppy anyway even if they dithered internally to 20 bits? It's just flipping the LSB. Probably it would look less like a square wave with a little plateu at the 0 crossing resulting in a slightly cleaner spectrum. No? It is a 20 bit DAC after all, you can't expect it to produce the AP waveform in the time domain.
The purpose of dither is to avoid those clear steps. Here is the AP digital signal at 20 bits with dither: