They are getting into active speaker market and you are right, this is their first amp.I had only known them for subs. Didn't know they were making amps.

-
WANTED: Happy members who like to discuss audio and other topics related to our interest. Desire to learn and share knowledge of science required. There are many reviews of audio hardware and expert members to help answer your questions. Click here to have your audio equipment measured for free!
You are using an out of date browser. It may not display this or other websites correctly.
You should upgrade or use an alternative browser.
You should upgrade or use an alternative browser.
Review and Measurements of Denon AVR-4306
- Thread starter amirm
- Start date
maty
Major Contributor
But if you look at the details, claims by Marantz are same as for their other current gear I posted earlier. Which puts the SINAD measures at a not very good -62 db range. The link you have shows .1% at 74.4 watts. That is only - 60 db before taking into account any residual noise. So again no better than the Behringer territory. That may be less audible than some think. .1% is about the edge of audibility and may be below it for much music. Considering there are other sources of distortion in the playback chain I'd like to see it around -80 db at least on distortion...
With FIVE channels on:
• Five channels driven into 8-ohm loads: 0.1% distortion at 74.4 watts; 1% distortion at 96.6 watts
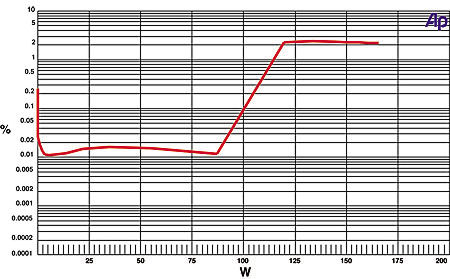
With TWO channels on:
This graph shows that the SR4500's left channel, from CD input to speaker output with two channels driving 8-ohm loads, reaches 0.1% distortion at 100.4 watts and 1% distortion at 114.6 watts. Into 4 ohms, the amplifier reaches 0.1% distortion at 128.2 watts and 1% distortion at 158.8 watts.
restorer-john
Grand Contributor
Don't know.
Maybe they use CEA-2006 car audio standards...
At least they have tackled the leveling of the playing field in terms of S/N
Signal to Noise Ratio (A weighted)
- This measurement will indicate the amount of audible noise inherent in the product. A major change to this measurement is the level at which it is made, previously, most products were measured for noise at full power, which resulted in amplifiers which had the same internal noise but having power differences, receiving different S/N ratings.
- The new method, requires the measurement of the noise at or 2Vrms (1 Watt @ 4W). This makes a true noise comparison possible, since an amplifier that has 20dB more power will not “automatically” have a S/N measurement 20dB better.
- Important to note, because the new measurement is designed to remove the additional power (in dB) from the measurement, most amplifiers will report a significantly lower S/N rating, when in fact they have the same performance as the customer is used to.
- For example, if an amplifier that made 100 watts @ 4W was measured with the old method, it may have a S/N ratio of -100dB
- The same amplifier, measured using CEA-2006, would result in a measurement of only –80dB . The 20dB difference is a result of removal of the 100 watts of power, since the difference between 1 watt and 100 watts is 20dB.
maty
Major Contributor
Yes, at Sound & Vision AVR measurements, the SNR-A is at 100 watts :-(
-> at 1 watt (2 Vrms, 8 Ohms) is 20 dB less.
The stereo and AVR amps, in others sites, the SNR-A is at 1 watt (2 Vrms, 8 Ohms).
-> at 1 watt (2 Vrms, 8 Ohms) is 20 dB less.
The stereo and AVR amps, in others sites, the SNR-A is at 1 watt (2 Vrms, 8 Ohms).
Last edited:
maty
Major Contributor
By the way,
AVR Marantz SR4500 (2004)
https://www.soundandvision.com/content/marantz-sr4500-av-receiver-ht-labs-measures
Distorsion always < 0.02% with power < 87 watts (8 Ohms)
AVR Marantz SR6012 (2017)
https://audio.com.pl/testy/kino-domowe/amplitunery-av/2955-marantz-sr6012
Distorsion only < 0.02% with power > 30 watts (8 Ohms)

Yamaha RX-A2060 (2016)
https://audio.com.pl/testy/kino-domowe/amplitunery-av/2776-yamaha-rx-a2060
Distorsion NEVER < 0.02%

Anthem MRX-520 (2016)
https://audio.com.pl/testy/kino-domowe/amplitunery-av/2772-anthem-mrx-520
Distorsion NEVER < 0.02%

The modern AVR have worse distorsion numbers.
Note 1: usually we listen music at home < 10 watts.
Note 2: we need more PEAK power to play orchestral music.
Note 3: the FFT (harmonics) graphs at audio.com.pl are at 8 watts if I am not wrong.
AVR Marantz SR4500 (2004)
https://www.soundandvision.com/content/marantz-sr4500-av-receiver-ht-labs-measures
Distorsion always < 0.02% with power < 87 watts (8 Ohms)
AVR Marantz SR6012 (2017)
https://audio.com.pl/testy/kino-domowe/amplitunery-av/2955-marantz-sr6012
Distorsion only < 0.02% with power > 30 watts (8 Ohms)
Yamaha RX-A2060 (2016)
https://audio.com.pl/testy/kino-domowe/amplitunery-av/2776-yamaha-rx-a2060
Distorsion NEVER < 0.02%
Anthem MRX-520 (2016)
https://audio.com.pl/testy/kino-domowe/amplitunery-av/2772-anthem-mrx-520
Distorsion NEVER < 0.02%
The modern AVR have worse distorsion numbers.
Note 1: usually we listen music at home < 10 watts.
Note 2: we need more PEAK power to play orchestral music.
Note 3: the FFT (harmonics) graphs at audio.com.pl are at 8 watts if I am not wrong.
Last edited:
The more I see the more convinced I am to just keep my old Sony integrated amp going while I still have passive speakers to drive. OK it may be twenty odd years old but looking around I am not sure any current model matches it's build quality, sound remains superb and it owes me nothing money wise. When I do upgrade that part of my system I will be looking to replicate my home office set up which has a pair of KEF X300A speakers I picked up cheaply and which just take a USB cable from my PC (or other devices) and knock out excellent sound. I wouldn't have paid full price for the KEF's but I got a clearance offer whereby they weren't much more than some of the BT speakers sold in supermarkets (I paid £250).
maty
Major Contributor
Measurements of some AVR Sony
https://audio.com.pl/testy/kino-domowe/amplitunery-av/f/1199-sony
AVR Pioneer
https://audio.com.pl/testy/kino-domowe/amplitunery-av/f/1160-pioneer
The very expensive AVR Arcam
https://audio.com.pl/testy/kino-domowe/amplitunery-av/f/979-arcam
Well, the very very expensive and "old" Arcam AVR600 yes. But the year is 2009.
https://audio.com.pl/testy/kino-domowe/amplitunery-av/2107-arcam-avr600
Distorsion only < 0.02% with power >20 watts (8 Ohms)
Last edited:
graz_lag
Major Contributor
Great deal you did @ £250, they normally are on sale @ 2x more.I wouldn't have paid full price for the KEF's but I got a clearance offer whereby they weren't much more than some of the BT speakers sold in supermarkets (I paid £250).
I have been considering these KEF's for my secondary system but decided not to buy them for the "very minor" limitation of the sampling rate @ 96kHz whilst 50% of my music files are @ 192.
Whether you can feel the difference though is another question !
I was more disturbed by the idea of purchasing a piece of hi-tech knowing it would have been delivered with a tech limitation somehow.
But they sounded great when I tested them in the auditorium fed from my Audiophile Linux laptop.
maty
Major Contributor
A very good and expensive integrated amplifer to have a reference:
ACCUPHASE E-650
[Polish] https://audio.com.pl/testy/stereo/wzmacniacze-stereo/2923-accuphase-e-650
to English with Google here.


[ Such high sensitivity, however, is not conducive to moving away from noise, and yet the E-650 is in this respect one of the best integrated amplifiers we've ever measured. The S / N ratio is 93 dB - this result is always excellent, and in the context of high sensitivity even performance... ]
ACCUPHASE E-650
[Polish] https://audio.com.pl/testy/stereo/wzmacniacze-stereo/2923-accuphase-e-650
to English with Google here.
- Rated power (1% THD + N, 1 kHz) [W] 8 Ω, 2x 66
- Rated power (1% THD + N, 1 kHz) [W] 4 Ω, 2x 132
- Sensitivity (for maximum power) [V] 1x 0.11
- Dynamics [dB] 111
- Damping factor (relative to 4 Ω) 438
- Rated power (1% THD + N, 1 kHz) [W] 2 Ω, 2x 219
[ Such high sensitivity, however, is not conducive to moving away from noise, and yet the E-650 is in this respect one of the best integrated amplifiers we've ever measured. The S / N ratio is 93 dB - this result is always excellent, and in the context of high sensitivity even performance... ]
Last edited:
Second hand you can get david belles class ab offerings for under $500. As a respected guy it might be worthwhile looking as just how well his designs measure.. would add to the 2 channel ab vs debate.
Plus i have his monoblock amps here so id be intrested personally too.
Plus i have his monoblock amps here so id be intrested personally too.
Man that is a sweet integrated, I give it an A for both electrical and cosmetic design. (do they have one in black?)A very good and expensive integrated amplifer to have a reference:
A very good and expensive integrated amplifer to have a reference:
ACCUPHASE E-650
[Polish] https://audio.com.pl/testy/stereo/wzmacniacze-stereo/2923-accuphase-e-650
to English with Google here.
- Rated power (1% THD + N, 1 kHz) [W] 8 Ω, 2x 66
- Rated power (1% THD + N, 1 kHz) [W] 4 Ω, 2x 132
- Sensitivity (for maximum power) [V] 1x 0.11
- Dynamics [dB] 111
- Damping factor (relative to 4 Ω) 438
- Rated power (1% THD + N, 1 kHz) [W] 2 Ω, 2x 219
[ Such high sensitivity, however, is not conducive to moving away from noise, and yet the E-650 is in this respect one of the best integrated amplifiers we've ever measured. The S / N ratio is 93 dB - this result is always excellent, and in the context of high sensitivity even performance... ]
maty
Major Contributor
I think that a good SS amp must have at least 0.1 % THD+N at 10 watts. Better at 1 watt.
The other thing very important is the SNR. With less noise you can hear more details and the sound is more 3D. Almost of my improvements in my system have consisted in eliminating all kinds of noise, noticing a lot the difference when listening to the many excellent recordings that I have. Much of them with DR > 13 dB (dynamic range); I have some tracks with DR 17 !!!!
Amplifiers and speakers too. And electrical grid (I have a very very very dirty grid, with a lot of DC too).
Last edited:
maty
Major Contributor
Now that nobody reads us ... the "old" integrated amp NAD C 375 BEE:
[Polish] https://audio.com.pl/testy/stereo/wzmacniacze-stereo/2473-nad-375-bee
to English with Google here


Only 816€
https://www.amazon.de/NAD-375BEE-Verstärker-Farbe-graphite/dp/B002CK9J4Y/ref=sr_1_1?ie=UTF8&qid=1541353654&sr=8-1&keywords=nad+375
With Black Alps.
[Hung] https://www.av-online.hu/hifi/nad-c-375bee-integralt-sztereo-erosito-teszt_1930
to English with Google here
[Polish] https://audio.com.pl/testy/stereo/wzmacniacze-stereo/2473-nad-375-bee
to English with Google here
- Rated power (1% THD + N, 1 kHz) [W] 8 Ω, 2x 200
- Rated power (1% THD + N, 1 kHz) [W] 4 Ω, 2x 307
- Sensitivity (for maximum power) [V] 1x 0.54
- Signal-to-noise ratio (A-weighted filter, with reference to 1W) [dB] 92
- Dynamics [dB] 116
- Damping factor (relative to 4 Ω) 51
Only 816€
https://www.amazon.de/NAD-375BEE-Verstärker-Farbe-graphite/dp/B002CK9J4Y/ref=sr_1_1?ie=UTF8&qid=1541353654&sr=8-1&keywords=nad+375
With Black Alps.
[Hung] https://www.av-online.hu/hifi/nad-c-375bee-integralt-sztereo-erosito-teszt_1930
to English with Google here
Great deal you did @ £250, they normally are on sale @ 2x more.
I have been considering these KEF's for my secondary system but decided not to buy them for the "very minor" limitation of the sampling rate @ 96kHz whilst 50% of my music files are @ 192.
Whether you can feel the difference though is another question !
I was more disturbed by the idea of purchasing a piece of hi-tech knowing it would have been delivered with a tech limitation somehow.
But they sounded great when I tested them in the auditorium fed from my Audiophile Linux laptop.
Good points on their limitations, for me that isn't an issue as I stick to FLAC or CDs, the more worrying aspect is the longer term durability since I suspect that if anything goes wrong with them the answer will be to ditch them as not being economical to repair. Given that these have built in amplifiers and a DAC they're a lot more complex than regular speakers which made me reluctant to buy them at SRP. However, for £250 they sound fantastic, feel very nicely built and if they don't last as long as passive speakers it isn't the end of the world. I really have been delighted with the sound and living with them has converted me to the idea of system speakers.
I'm not sure what the translation mean who the "producer" is but yes, I agree.
A amp rating system that picked the sweet spot of the curve would be best. In that case slightly less than 150 watts for 8 ohms, more like 125.
"NAD is the strength of this test. Although the producer himself is quite cautious in declarations, announcing 2 x 150 W (regardless of the load), this laconic information does not reflect the real potential of the amplifier."
Good point and one I haven't heard voiced before about actives in general. There's a lot to go bad inside them and repair costs might be a significant factor as they age. Too many products have proven to be a bit unreliable.the more worrying aspect is the longer term durability since I suspect that if anything goes wrong with them the answer will be to ditch them as not being economical to repair.
- Joined
- Feb 23, 2016
- Messages
- 20,771
- Likes
- 37,635
Some of these graphs of THD+noise vs power point to why I don't like that spec. I prefer to look at noise and look at THD. The typical shape we see above usually indicates THD is staying rather low, and is being swamped by noise as the signal level goes down. I'd prefer a 3D plot showing THD, noise and power on 3 axis.
If you look at the same graph for the Denon it is better than any of these other graphs posted as it stays almost flat into lower powers, and eventually doesn't rise as much. That is because the Denon is relatively low in distortion, but much lower in noise than the others pieces of gear. We can hear into noise some 10-20 db. So the spectrum of the noise vs the signal will mean two similar plots at low signals may sound a bit different.
Optimum of course is pairing low thd with low noise.
Here as a point of reference is a Bel Canto Black as measured by Stereophile showing that switching amps can do well.

The Bel Canto Ref 600 mono which stays below .01% until past 200 wpc. It has a bit different shape on the THD+N curve than usual.

Now these are not inexpensive nor even necessarily the best that can be had. Just thought it worth showing what is possible.
Here is an earlier IcePower based Bel Canto. It stays below .1 % from lowest powers to highest powers.

Here is a Mark Levinson 536 which is a class AB amp which stays below .02% at 400 wpc and is .004% at 1 watt. Because it low noise and low distortion.

And even better at much less cost (though less power) is the Benchmark Amp. Never worse than .0005% and mostly around .0001%.

All these measurements from Stereophile testing.
So I'd like to see an amp have such a curve that is .01% or less at all levels up to rated power. Plenty have low enough THD, but many affordable amps don't have low enough noise. Such a curve at .1% and less might be inaudible, but having the extra 20db room for certainty is very possible with modern amps.
If you look at the same graph for the Denon it is better than any of these other graphs posted as it stays almost flat into lower powers, and eventually doesn't rise as much. That is because the Denon is relatively low in distortion, but much lower in noise than the others pieces of gear. We can hear into noise some 10-20 db. So the spectrum of the noise vs the signal will mean two similar plots at low signals may sound a bit different.
Optimum of course is pairing low thd with low noise.
Here as a point of reference is a Bel Canto Black as measured by Stereophile showing that switching amps can do well.
The Bel Canto Ref 600 mono which stays below .01% until past 200 wpc. It has a bit different shape on the THD+N curve than usual.
Now these are not inexpensive nor even necessarily the best that can be had. Just thought it worth showing what is possible.
Here is an earlier IcePower based Bel Canto. It stays below .1 % from lowest powers to highest powers.
Here is a Mark Levinson 536 which is a class AB amp which stays below .02% at 400 wpc and is .004% at 1 watt. Because it low noise and low distortion.
And even better at much less cost (though less power) is the Benchmark Amp. Never worse than .0005% and mostly around .0001%.
All these measurements from Stereophile testing.
So I'd like to see an amp have such a curve that is .01% or less at all levels up to rated power. Plenty have low enough THD, but many affordable amps don't have low enough noise. Such a curve at .1% and less might be inaudible, but having the extra 20db room for certainty is very possible with modern amps.
restorer-john
Grand Contributor
Some of these graphs of THD+noise vs power point to why I don't like that spec. I prefer to look at noise and look at THD. T
There's plenty of us here who feel exactly the same.
Similar threads
- Replies
- 29
- Views
- 2K
- Replies
- 319
- Views
- 67K
- Replies
- 16
- Views
- 1K
- Replies
- 4
- Views
- 455
- Poll
- Replies
- 272
- Views
- 53K