After a year of development, I finally released the first version of an audio spectrum viewer app I have been working on as a retirement hobby. The executable is a single file and there is no installation step. You just run it. Download the windows executable along with demo files and source code from sourceforge. I hope you can find a use for it. There is no anti-aliasing filter at this point.
I wanted to test sample bit depths higher than those from my PC motherboard, so I added the ability to read input from a wave file instead of the windows audio. Almost all of the included demo examples use wave files. Most are generated by the spectrumViewer app itself, though a couple need sox.exe.
Here are some screenshots. They are all included in the download, including batch files to recreate them with one mouse click.
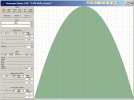
The first is a test of frequency measurement resolution. I made a wave file of 1234.5678 Hz sine, then used spectrumViewer to measure the frequency:
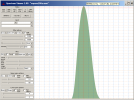
Just for fun: a 10 Hz square wave at 192,000 sampling rate should have harmonics at 10, 30, 50, ..., 95900, right? This test is to zoom into that last harmonic, the 9,590th harmonic. No problem. Well, the CPU usage shows 90.5%, so it's actually a struggle even on my fairly powerful desktop computer:
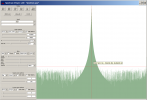
Next is a view of instrument noise. The input sample bit depth of this app is limited to the 53 bits provided by the IEEE double precision floating point format of wave files. That is no higher precision than the math used by the app. Ideally the test input would have higher resolution than the instrument under test. A way around this problem is to use a sine wave with a frequency that is exactly 3, 4, or 6 samples per cycle. This avoids the unwanted harmonics caused by rounding to the sample size (amazing to me, maybe something for another discussion).
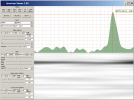
Here are frequency measurements of two electronic watches.

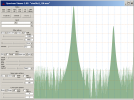
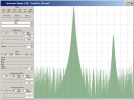
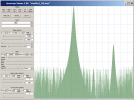
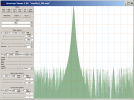
I wanted to test the noise attributable to limited sample bit depth using a sine wave. I had to write my own code to produce these wave files, because I couldn't find a free utility that goes beyond the 32-bits of sox. Problem is, my waves are undithered. For measurement and learning use, that can be good. But it results in a different looking noise pattern for every frequency. I ended up choosing a frequency of 1/5 the sampling rate. With this frequency, the noise caused by round-off of the sample data is all at the second harmonic. It's not the maximum possible noise, but the large second harmonic is easy to spot, even with high bit depth. Here is 16, 24, 32, and 53 bit. That huge second harmonic peak declines with increasing sample bit depth, until it's equal to the instrument noise floor at 53 bits.
I wanted to test the log and linear power scales from 0 to -300 dB. I made a batch file to do this. The screen shots aren't too interesting because the test works by playing each level for a second and confirming it steps down accurately.
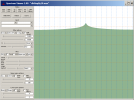
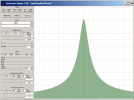
Another way to test level measurement accuracy. These two level test signals (log and linear) are generated by sox:
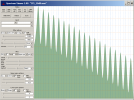

Another accuracy test. How does the level of a square wave second harmonic compare to the fundamental? I believe the delta is 20 * log10 (1/3), or 9.54 dB lower. Here is an example of zooming in to show both those peaks in the same view. When using spectrumViewer to measure peaks, be sure to back off the Q setting enough to avoid a sharp point at the peak. A sharp point can get lost if narrower than a single pixel column. From the image, we get -10.44 for the second harmonic and -.9 for the first, for a delta of 9.54. On the money!
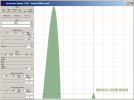
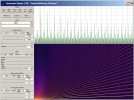
Here is a sawtooth sweep. It's full of aliasing, which creates interesting patterns:
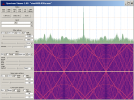
Another interesting pattern for certain frequencies when no dithering is used:
Encoding an image into an audio file isn't something I am too interested in. But it makes a very good test during development. I used an example from Marco Barnig's page. I ended up finding a better encoder, and re-encoded his sample image into a wave file that is both smaller and higher resolution:

Give it a try.
I wanted to test sample bit depths higher than those from my PC motherboard, so I added the ability to read input from a wave file instead of the windows audio. Almost all of the included demo examples use wave files. Most are generated by the spectrumViewer app itself, though a couple need sox.exe.
Here are some screenshots. They are all included in the download, including batch files to recreate them with one mouse click.
The first is a test of frequency measurement resolution. I made a wave file of 1234.5678 Hz sine, then used spectrumViewer to measure the frequency:

Just for fun: a 10 Hz square wave at 192,000 sampling rate should have harmonics at 10, 30, 50, ..., 95900, right? This test is to zoom into that last harmonic, the 9,590th harmonic. No problem. Well, the CPU usage shows 90.5%, so it's actually a struggle even on my fairly powerful desktop computer:

Next is a view of instrument noise. The input sample bit depth of this app is limited to the 53 bits provided by the IEEE double precision floating point format of wave files. That is no higher precision than the math used by the app. Ideally the test input would have higher resolution than the instrument under test. A way around this problem is to use a sine wave with a frequency that is exactly 3, 4, or 6 samples per cycle. This avoids the unwanted harmonics caused by rounding to the sample size (amazing to me, maybe something for another discussion).

Here are frequency measurements of two electronic watches.


I wanted to test the noise attributable to limited sample bit depth using a sine wave. I had to write my own code to produce these wave files, because I couldn't find a free utility that goes beyond the 32-bits of sox. Problem is, my waves are undithered. For measurement and learning use, that can be good. But it results in a different looking noise pattern for every frequency. I ended up choosing a frequency of 1/5 the sampling rate. With this frequency, the noise caused by round-off of the sample data is all at the second harmonic. It's not the maximum possible noise, but the large second harmonic is easy to spot, even with high bit depth. Here is 16, 24, 32, and 53 bit. That huge second harmonic peak declines with increasing sample bit depth, until it's equal to the instrument noise floor at 53 bits.


I wanted to test the log and linear power scales from 0 to -300 dB. I made a batch file to do this. The screen shots aren't too interesting because the test works by playing each level for a second and confirming it steps down accurately.


Another way to test level measurement accuracy. These two level test signals (log and linear) are generated by sox:


Another accuracy test. How does the level of a square wave second harmonic compare to the fundamental? I believe the delta is 20 * log10 (1/3), or 9.54 dB lower. Here is an example of zooming in to show both those peaks in the same view. When using spectrumViewer to measure peaks, be sure to back off the Q setting enough to avoid a sharp point at the peak. A sharp point can get lost if narrower than a single pixel column. From the image, we get -10.44 for the second harmonic and -.9 for the first, for a delta of 9.54. On the money!

Here is a sawtooth sweep. It's full of aliasing, which creates interesting patterns:

Another interesting pattern for certain frequencies when no dithering is used:

Encoding an image into an audio file isn't something I am too interested in. But it makes a very good test during development. I used an example from Marco Barnig's page. I ended up finding a better encoder, and re-encoded his sample image into a wave file that is both smaller and higher resolution:

Give it a try.