Honestly, I find those graphs interesting from an Engineering standpoint, those who like to contemplate the minutia of driver design, etc, can stare at them all day and still be entertained. But I find them utterly useless from a practical standpoint for the end user.
If it's a flat measuring speaker and the end user wants to know (from the title of the thread) How Loud,? it's implicit he means "Will it play flat?" If a speaker can play 120 dB at 1K, that's great, but it's completely useless if it can only play 108 dB at 100 Hz. If it can only play 108 at 100 Hz, its useful limit is 108--it really doesn't matter if it can hit 140 dB at some other frequency. That's not useful.
I think simple compression tests, like those performed by Erin but at higher levels for larger speakers are infinitely more useful. And yes, distortion measurements at those levels would be useful as well. If one wants to be more "scientific" about it and include distortion, I don't think you'll do better than testing according to AES75.
That tells the end user "How Loud" a speaker will play without significantly changing its frequency response and without audibly objectionable levels of distortion. Isn't that what actually matters to the end user? The graphs above don't answer any of those questions.
Interesting reaction. S&R publishes compression information as well, but not always.
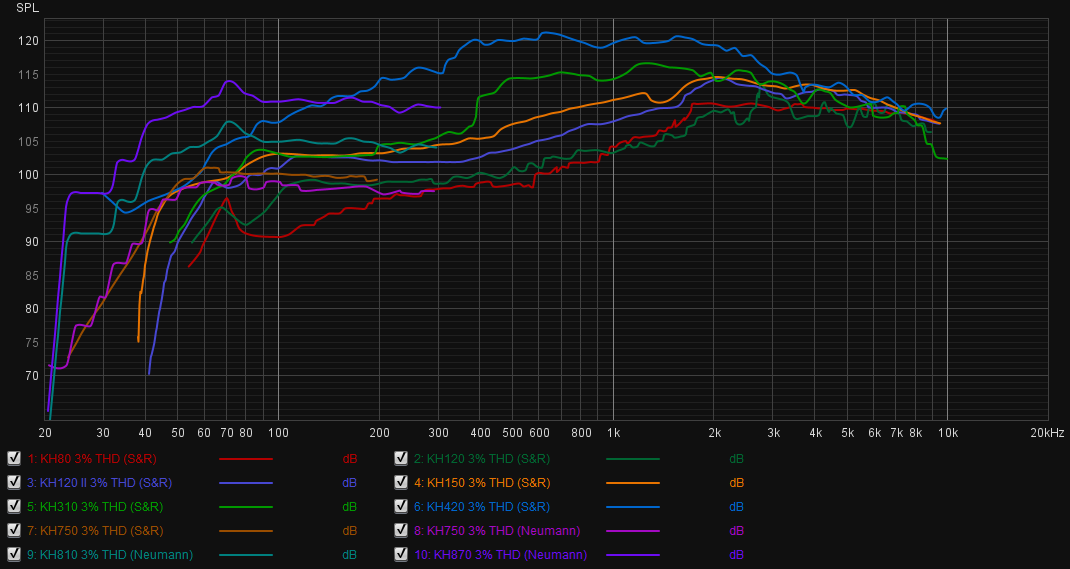
Take this into account: we don't have all the data. We are put into a position where we have to infer performance indirectly. Consumers are made to do that all the time, and make poor inferences all the time based on we all know what. The chart above helps me because it presents all the data at once and shows, clearly, performance advantages. Interpreting those is another step.
Power compression and the attendant change in FR and audible distortion can inferred from this chart, too, sort of. I'll repeat again that these are, indeed, max SPL measurements because SPL does not rise, other somewhat in the LF, if you allow more distortion. the 10% traces are usually identical.
Here are the 3% vs. 10% max SPL traces for the 8361A:
Here we have the 8361A FR at 106dB measured by
@amirm vs. the 3% trace. The comparison is fair since we are looking at SPL information.
This is a review and detailed measurements of the Genelc 8361A studio monitor (powered active speaker). It is on kind loan from a member and costs US $4,995. The 8361A looks identical to the rest of the series except massively scaled up: It doesn't look it but it is extremely heavy. It has a...

www.audiosciencereview.com
The way I see it, if you ask the speakers to push beyond 100dB SPL you will have to expect some compression and some audible distortion. Not precise, but ok.
Now the 3% vs. 10% max SPL traces for the 8331A:
Here's the 8331 compression/linearity measured by Erin vs. the 3% trace. This is somewhat unfair since Erin's chart represents deviation, but sort of works if you take the flattest portion to represent the needed level given that the units still refer to dB SPL.
Genelec 8331A Review
www.erinsaudiocorner.com
So don't push it beyond 90-95dB SPL.
Etc.