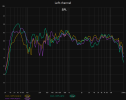
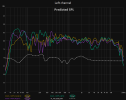
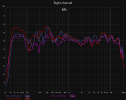
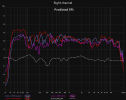
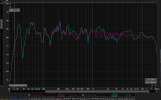
Please note I know its a terrible curve but thats not the point of these graphs. It’s purely to show how much variation the room makes. I find this helps me to put into perspective how we can get a bit too obsessed with a flat curve, especially when listening in different positions.
-
WANTED: Happy members who like to discuss audio and other topics related to our interest. Desire to learn and share knowledge of science required. There are many reviews of audio hardware and expert members to help answer your questions. Click here to have your audio equipment measured for free!
You are using an out of date browser. It may not display this or other websites correctly.
You should upgrade or use an alternative browser.
You should upgrade or use an alternative browser.
FR variation around MLP, SPL in perspective
- Thread starter dweeeeb2
- Start date
- Joined
- Feb 23, 2016
- Messages
- 20,793
- Likes
- 37,697
Did you know you can show all the graphs together on one screen if you save the mdat files from each measurement and then open them together?
- Thread Starter
- #3
Yes, but it just becomes a mess where you can only really see max and min at a given frequency. I seperated them out so the variation at each point could be seen easier.Did you know you can show all the graphs together on one screen if you save the mdat files from each measurement and then open them together?
Single point measurements are not very useful or representative of what we hear in the first place, except for low frequencies where the change over distance is less.
That's why you need to average bunch of measurements together to properly configure room correction or use MMM.
You can certainly achieve smooth and flat measurements across multiple listening positions in bass at the very least with multiple subs.
That's why you need to average bunch of measurements together to properly configure room correction or use MMM.
You can certainly achieve smooth and flat measurements across multiple listening positions in bass at the very least with multiple subs.
ernestcarl
Major Contributor
Yes, but it just becomes a mess where you can only really see max and min at a given frequency. I seperated them out so the variation at each point could be seen easier.
I suggest to supplement single-point sweeps with moving microphone measurements/method (MMM) spaced across different listening areas. I know you said not to "obsess", but it is easier to see what can be improved with EQ across a wider listening area that way.
Sokel
Master Contributor
- Joined
- Sep 8, 2021
- Messages
- 6,158
- Likes
- 6,253
See what happens at the actual way of listening:

 www.audiosciencereview.com

Does Phase Distortion/Shift Matter in Audio? (no*)
I agree but it still sort of shows that at least the math has figured how the brain interprets information received from both ears in terms of locating sound sources in 3D. No. It's just a simple capture of how head and torso distort pressure at the eardrum and then the same filtered response...
 www.audiosciencereview.com

Did you know you can show all the graphs together on one screen if you save the mdat files from each measurement and then open them together?
Yes, but it just becomes a mess where you can only really see max and min at a given frequency. I seperated them out so the variation at each point could be seen easier.
Thank you for sharing, but just an FYI REW has a "separate traces" feature that allows you to clearly display multiple traces at once without having to manually shift their SPL. See: https://www.roomeqwizard.com/help/help_en-GB/html/overlays.html > Separate Traces
Anyway, on one hand, as others have mentioned, this is why averaging is so important
On the other hand, I agree it's important not to obsess too much over in-room measurements.
This also brings up a common misunderstanding about the "predicted in-room response," curve (and by extension, early reflections curve) by the way. People see the PIR and assume it'll match a simple listening position measurement, or even a simple MMM or average at the listening seat. But the PIR as tested in at least Olive, 2004 (Part 2) is quite specific about how it was measured:
"A diffuse-field microphone was positioned at the listener's chair, at average ear height, 3m away from the loudspeaker. The loudspeaker was placed 1.2m from the rear wall, slightly off-center from the side walls of the room. A total of 9 measurements were taken at 0, +/- 10, +/- 20, +/- 30 degrees horizontal, and +/- 10 vertical."
In other words, the PIR basically reflects the listening window of the speaker at 3 meters away, quite a distance away. Note that's also a singular speaker, not a stereo pair.
That's actually quite a large area and I 'd be surprised if most people are doing MMM or averaging quite that large when they measure their PIR. I also wonder what the effect is of having the speaker be "slightly off center" as opposed to closer to the sidewall as it would be in a standard setup.
that ~60Hz null really varies a lot.View attachment 353136View attachment 353137View attachment 353138View attachment 353139View attachment 353140View attachment 353141View attachment 353142View attachment 353143View attachment 353144So I think some people could find this interesting, particularly if you haven’t played around with REW. Below are a bunch of REW SPL v Freq graphs. I’m showing them to demonstrate just how much FR varies based on position in the room. These measurements are all taken just around the MLP, none are more then 0.5m from the MLP. Same speakers 2.1, same setup each trace done one after the other. Only the microphone was moved.
Please note I know its a terrible curve but thats not the point of these graphs. It’s purely to show how much variation the room makes. I find this helps me to put into perspective how we can get a bit too obsessed with a flat curve, especially when listening in different positions.
- Thread Starter
- #9
I did this test because I wasn’t happy with how my system was sounding. I felt like I was chasing my tail. I needed to know just how “smooth” the in room response needed to be. What magnitude peaks and dips had I and most “audiophools” been listening to before using DSP. I figured my Lintons are considered to be ok speakers (at least far superior to anyone else in my life, and they sounded better than my old klipsch) but my triangular room is a reflective mess.
So it occurred to me that I should measure a few points and accept that that is how much variation is commonly heard when simply plonking your brand new expensive speakers down, then moving your head.
To me the variation was surprising, and gave some perspective to what I can and can’t hear on a graph.
I get the point that single measurements are flawed for EQ’ing and personally I love the MMM, but at any given time when your head is still doesn’t the single point measurement represent what you hear at that point?
It doesn't, actually! Dr. Toole talks about this a lot in his book. Something along the lines of two ears and a brain are not the same as a single microphone measurement. A lot of the dips and peaks that show up on a single microphone measurements are essentially filtered out by our brain, especially if they come from lateral reflections.I get the point that single measurements are flawed for EQ’ing and personally I love the MMM, but at any given time when your head is still doesn’t the single point measurement represent what you hear at that point?
- Thread Starter
- #11
Does he say much about fatigue? I just assumed that this filtering process was part of listener fatigue. You may not hear the peaks but it gets fatiguing.It doesn't, actually! Dr. Toole talks about this a lot in his book. Something along the lines of two ears and a brain are not the same as a single microphone measurement. A lot of the dips and peaks that show up on a single microphone measurements are essentially filtered out by our brain, especially if they come from lateral reflections.
I’ll have to go and have another look at his book.
thanks
No, I don't think that has anything to do with the specific phenomenon. If anything, I think much of the time I remember this filtering coming up, it's in a positive context, reflections helping with speech intelligibility and apparent source width etc.Does he say much about fatigue? I just assumed that this filtering process was part of listener fatigue. You may not hear the peaks but it gets fatiguing.
I’ll have to go and have another look at his book.
thanks
Not to say all reflections or filtering is good, but to our brains, it depends on both the direction and delay between the direct and reflected sound. Single microphone FR sweeps don't tell you anything about direction or timing. Even the effect of vertical reflections isn't totally clear. While understood to negatively affect tonality more than lateral reflections, it's not clear to what degree. It seems inconclusive how much of an improvement treating the floor reflection is, for example, since we're always on floors lol.
Similar threads
- Replies
- 4
- Views
- 580
- Replies
- 4
- Views
- 532
- Poll
- Replies
- 26
- Views
- 1K
- Replies
- 1
- Views
- 496
