• Welcome to ASR. There are many reviews of audio hardware and expert members to help answer your questions. Click here to have your audio equipment measured for free!

FFT Size impact on Noise level in Virtins Multi Instrument 3.8 ? - FIXED in v3.9

Rja4000

Major Contributor
Forum Donor
Joined
May 31, 2019
Messages
3,321
Likes
6,150
Location
Liège, Belgium
Hi
I thought I'd create a new thread about this topic.

I originaly posted my question here
Detailed analysis will be in next post

Here-under is the original question:
Yes. Here is the amount of "FFT gain" (measurement noise reduction) for different number of audio samples used:

32K = 42 dB
256K = 51 dB
1 million = 57 dB

The actual dB is a few dB different since it also includes the effect of the FFT Window. But is not material in grand scheme of things.
Hi

This "gain" is the level drop for noise in the display (or for the distortion analysis).
But it's not impacting SNR or SINAD, or does it ?

Actually, I see some impact of FFT size on SNR, but that's nowhere near linear.
And I have no clue what's causing that.
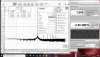
Example of a Loopback FFT Size/SNR

SNRvsFFTSize.PNG


And this looks quite random, on top of it: I've seen 128k being higher than 32k for other configurations, as an example.

Does anyone know why ?
At lower FFT size, it looks like there is high low frequency noise, due to the fuzzy frequency resolution.
But why do we see variation above 16k points ?

Notes: sampling frequency in this example was 48kHz
I get the same figures for the same config anytime
I also read the exact same values from Multi Instrument and from REW
 
Last edited:
I've performed more analysis

First, I realised that the exact frequency in the signal generator should be selected as a function of sampling rate AND of the FFT Size, to avoid "spectral leak"

Here is an example of a test with a FFT size of 2048 points
First with a fixed 1000Hz sine
FFT Size MI    2k Leak.jpg


The result is horrible, isn't it ?
But that is most probably due to the 23.4375Hz "Resolution" for that low FFT size.
(See this value in bottom left of the spectrum window)

By properly selecting a frequency close to 1kHz, but in function of both Sampling rate and FFT Size, we get the following
FFT Size MI    2k No Leak.jpg


Much more in line with what I expected !
Frequency is now 1007.8125Hz

Now, I repeated the same test for each Window size up to 1024k points:

FFT Size 4k points
FFT Size MI    4k No Leak.jpg


FFT Size 8k points
FFT Size MI    8k No Leak.jpg


FFT Size 16k points
FFT Size MI   16k No Leak.jpg


FFT Size 32k points
FFT Size MI   32k No Leak.jpg


FFT Size 64k points
(note that it's more than sampling frequency)
FFT Size MI   64k No Leak.jpg


FFT Size 128k points
FFT Size MI  128k No Leak.jpg


FFT Size 256k points
FFT Size MI  256k No Leak.jpg


FFT Size 512k points
FFT Size MI  512k No Leak.jpg


FFT Size 1024k points
FFT Size MI 1024k No Leak.jpg


We see the noise graph becoming lower and lower in the Spectrum display.
This was to be expected.

What was NOT expected for me are the changes in measured Noise Level and SNR values.
(Also, at 1024k points, everything crashes. That may be linked to the PC CPU Load.)

I've recorded all those values in a table (rounding to integers, to take into account the test repeatability)
MI Table.PNG

(Note H2-H5 are the values shown as 'fxRMS' above minus the level, to have their relative value vs signal, as in THD)

THD is pretty stable (as from an FFT Size of 8k),
but SNR and NL (Noise Level) vary quite a lot !
And so does SINAD, of course, since it's mainly linked to noise here.


Tests with REW

I repeated the same tests with REW
Same configuration exactly.

Note that REW, per default, adapts the frequency in the Sine generator to the FFT Size if you check the "Lock Frequency to RTA FFT" checkbox.
(Multi Instrument is also doing that if you want)

I have all sizes from 8k to 1024k, but I'll post just 3 here:

REW FFT Size 8k points
FFT Size REW    8k No Leak.jpg


REW FFT Size 64k points
index.php


REW FFT Size 1024k points
FFT Size REW 1024k No Leak.jpg


REW Table.PNG

(Note the frequencies: they were selected automatically by REW. They are the same I computed for MI)

REW gives much more stable values
THD values are pretty much the same than Multi Instrument
But noise varies much less.

Bottom line (for now)

There is probably a problem in the way Virtins Multi Instrument (3.8) computes the Noise values when FFT Window Size changes.
The problem is visible here for FFT Window size >64k points.
Fortunately, for standard FFT points number around Sampling Frequency value, the results seem OK and are comparable to REW.

I like Virtins Multi Instrument a lot.
The Value of the 'pro' version is excellent, in my opinion. Automation is also very handy. (A must for me, actually !)
So having it measuring accurate values is key for me.

@VIRTINS: Any comment ?
Is there something I missed ?


Test conditions
RME ADI-2 Pro fs in Loopback
Output: Balanced phone mode in Lo power mode (+13dBu), level set to -2.5dBFS
Input: Both XLR Analog inputs, +13dBu range
Analog input "M/S proc" on (average of both analog inputs on left channel)
Left channel ("M") measured.
Spectrum band-filtered to 20Hz-20kHz, 4 averages
No weighting
@MC_RME: The ADI-2 Pro is a beast ! :)
 

Attachments

  • 1569752994698.png
    1569752994698.png
    56.7 KB · Views: 185
  • FFT Size REW   64k No Leak.jpg
    FFT Size REW 64k No Leak.jpg
    239.2 KB · Views: 1,136
Last edited:
It looks like the noise floor of your system is around 110~113 dB so increasing FFT size does not help below that.

Processing gain is logarithmic, not linear, at roughly 10log(N/2) for N samples. Lots of online references, here is one: https://www.designnews.com/aerospace/where-does-fft-process-gain-come/100022666833951

Well, in the measurements from the second post, I think the noise is rather around -115dB~-116dB below signal here (which is -2.4dBFS, so "Noise Level" should be -117~-119dBFS).

Other than that, I'm aware of the processing gain... which we see in the plots: The noise seems to get lower as the FFT size increases.
But, as long as the level remains the same, the SNR figure should NOT change, as far as I know. And it does, in Multi Instrument.
 
Last edited:
One good thing with Virtins is that their support is answering questions, usually with a lot of explanations.

Here, they started to answer:
https://www.virtins.com/forum/viewtopic.php?f=7&t=1382#p2068
Which explains why we have that hump in measurements on low frequencies at 2k points, when frequency is not aligned with FFT boxes.
And how to avoid it.
 
Last edited:
They've actually posted more details.
Well worth reading.

I still don't have a definitive explanation why we see that step in Noise Level and SNR between a FFT window size of 32768 and 131072 though.

I'll perform more tests when possible.

@SIY: As a Multi Instrument user, did you ever noticed that behaviour ?
 
Virtins support actually found some error:
Virtins said:
We have (...) done a detailed investigation and found that these strange behaviours occur only when the signal level (S) is roughly 165 dB or more above the "apparent" noise level. This condition will be satisfied only when FFT size is very large, the noise level of the test is extremely low, and the signal level is close to the maxium.
The cause of the issue has something to do with how to maintain the required precision during numerical computation.
We have improved the code in our internal version and it will be released soon in MI 3.9.

https://www.virtins.com/forum/viewtopic.php?f=7&t=1382&p=2108#p2100

Thanks to them !

Not everyone is willing to admit that their own product may require improvement. And be ready to improve it.

My favorite measurement software may now become even better :)
 
Last edited:
I read here (chapter 3.4) that the FFT processing gain in dB computes as:
1716300781885.jpeg

where N is the length of the FFT.

For me this means if I see a certain noise floor in the FFT I have to add the corresponding processing gain to get its real value.
Any comments on that?
 
I don't think so... Hand-waving quick thoughts:

Processing gain is related to the number of points in the FFT, which determines the frequency bin size and thus the amount of noise in each bin (FFT point). It affects the noise floor of the FFT but should not affect the overall (integrated) noise level, so if by "real value" you mean the integrated (e.g. RMS) noise, then processing gain should not affect that. If you are looking at the noise floor, i.e. the amount of noise captured in each FFT bin, then ideally you should use enough points that the actual ("real") noise floor of the device under test is above the FFT's noise floor. In other words, use enough points (and thus have large enough processing gain) that the noise floor is limited by the device you are testing and not the the resolution (and thus noise floor) of the FFT.
I tried to figure it out for me with an example and it seems to work as described in the paper that I liked to in my first post above.

This is what I did:
  • Created a 750Hz signal (-1dB) 24Bit 48kHz dithered in the last bit so no aliasing expected.
  • Put 64k samples of this signal to a FFT and normalized the FFT result to -1dB. This is how it looks like:
    1716303175849.png
  • Calculating the FFT Processing Gain with the formula above gives me 45.15dB
  • As the LSB of my 24Bit signal is dithered I expect noise at -138.47dB
  • Substracting the 45.15dB Processing Gain from the calculated -138.47dB I get -183,63dB and this is approx. where I see the noise level in my diagram.
So for me this formula seems to make a lot of sense.
 
I tried to figure it out for me with an example and it seems to work as described in the paper that I liked to in my first post above.

This is what I did:
  • Created a 750Hz signal (-1dB) 24Bit 48kHz dithered in the last bit so no aliasing expected.
  • Put 64k samples of this signal to a FFT and normalized the FFT result to -1dB. This is how it looks like:
    View attachment 370593
  • Calculating the FFT Processing Gain with the formula above gives me 45.15dB
  • As the LSB of my 24Bit signal is dithered I expect noise at -138.47dB
  • Substracting the 45.15dB Processing Gain from the calculated -138.47dB I get -183,63dB and this is approx. where I see the noise level in my diagram.
So for me this formula seems to make a lot of sense.
Yes, perhaps I misunderstood what you were asking. The formula makes perfect sense -- for the FFT. It does not change the actual integrated noise of the FFT, and the FFT noise floor is not related to the noise floor of the device under test. That is, too high an FFT noise floor (i.e. sample size and thus processing gain too low) will present an unrealistically high device noise floor, so you want enough points that the noise floor you are measuring is the actual noise floor and not just set by the FFT. I was thinking of measuring things (devices), and agree it is important to understand processing gain to ensure the FFT's noise floor is (well) below what you are testing. The formula is good for that.

Sorry, carry on!
 

Attachments

I tried to figure it out for me with an example and it seems to work as described in the paper that I liked to in my first post above.

This is what I did:
  • Created a 750Hz signal (-1dB) 24Bit 48kHz dithered in the last bit so no aliasing expected.
  • Put 64k samples of this signal to a FFT and normalized the FFT result to -1dB. This is how it looks like:
    View attachment 370593
  • Calculating the FFT Processing Gain with the formula above gives me 45.15dB
  • As the LSB of my 24Bit signal is dithered I expect noise at -138.47dB
  • Substracting the 45.15dB Processing Gain from the calculated -138.47dB I get -183,63dB and this is approx. where I see the noise level in my diagram.
So for me this formula seems to make ;)a lot of sense.
What changes with number of FFT bins is the apparent level of the noise on the FFT plot.
If you plot the above at, say, 256k FFT size, you'll see a corresponding decrease of apparent noise floor.
But as said above, the total RMS noise measure for, say, 20Hz-20kHz will remain unchanged (except if your software has a bug, like I reported above).

The bottom line is: don't compare visually 2 FFT plots for noise level without knowing the FFT size and making sure they are equal.

As a more practical example: don't compare Amir's Multitone 32 plots to others' for noise level. ;)
 
As a more practical example: don't compare Amir's Multitone 32 plots to others' for noise level.
We also have to keep in mind that the visible noise floor in a dense multitone with 32 evenly log-spaced frequencies is congested with all the distortion products and the real noise floor (with FFT gain effect) often is not actually visible. This is one of the reasons I tend to prefer sparse (like 7 or so) multitones located on exact constant N bins multiples that leave room for "pure noise" bins. REW has a nice option for that.

The bottom line is: don't compare visually 2 FFT plots for noise level without knowing the FFT size and making sure they are equal
This!
Ideally, all specs for the FFT process should be stated, like window, averaging details, sample-rate
 
We also have to keep in mind that the visible noise floor in a dense multitone with 32 evenly log-spaced frequencies is congested with all the distortion products and the real noise floor (with FFT gain effect) often is not actually visible. This is one of the reasons I tend to prefer sparse (like 7 or so) multitones located on exact constant N bins multiples that leave room for "pure noise" bins. REW has a nice option for that
Well, except if you use Audio Precision's Multitone 32 signal.
It's perfectly aligned with FFT bins, and if you have ADC and DUT in sync, you'll be able to use double the FFT size the test signsl was created for and sum energy of all odd order FFT bins to get a measurement of noise without any distortion product. Says AP.
 
In the documentation for WaveGene and WaveSpectra, the developer explains that for optimum THD / noise measurements, the frequency should fall exactly in a 'bin'. I seem to recall that Picoscope mention the same thing in their documentation.

WaveGen / WaveSpectra explanation here https://gtkc.net/wavespectra-and-wavegene-thd-measurement (the original site of the developer no longer exists).
Well, that's usually what I do.

Also, REW and Multi Instrument allow an automatic alignment of the test signal frequency with FFT bins.
Audioprecision's multi tone 32 signal may also be aligned with bins.

The benefit is that you may not need a Window function (when using a window function, REW, as an example, uses Bkackmann-Harris 7. MI defaults to Kaiser 6. AP has its own AP-Equiripple. All softwares allow a choice of window function. Or to use none - also called "rectangke").
The benefit of not using a window function is that the level measurement is more accurate. (Slightly, since function impact can be more or less predicted, and compensated for.)

BUT -and that's a big But- it doesn't work when the ADC and DUT are not synced, don't have exactly the same (or multiple) sampling frequency, or when the delay between them is too high.
 
Most test standards (e.g. IEEE) state you should bin the frequencies for best results, which as @Rja4000 says also requires precise clock synchronization, and in the real world all bets are off. Most all papers about FFT noise floor include examples of window functions that usually impose limits well above the FFT noise floor.
 
Back
Top Bottom