
KSTR
Major Contributor
Part 1 : Introduction
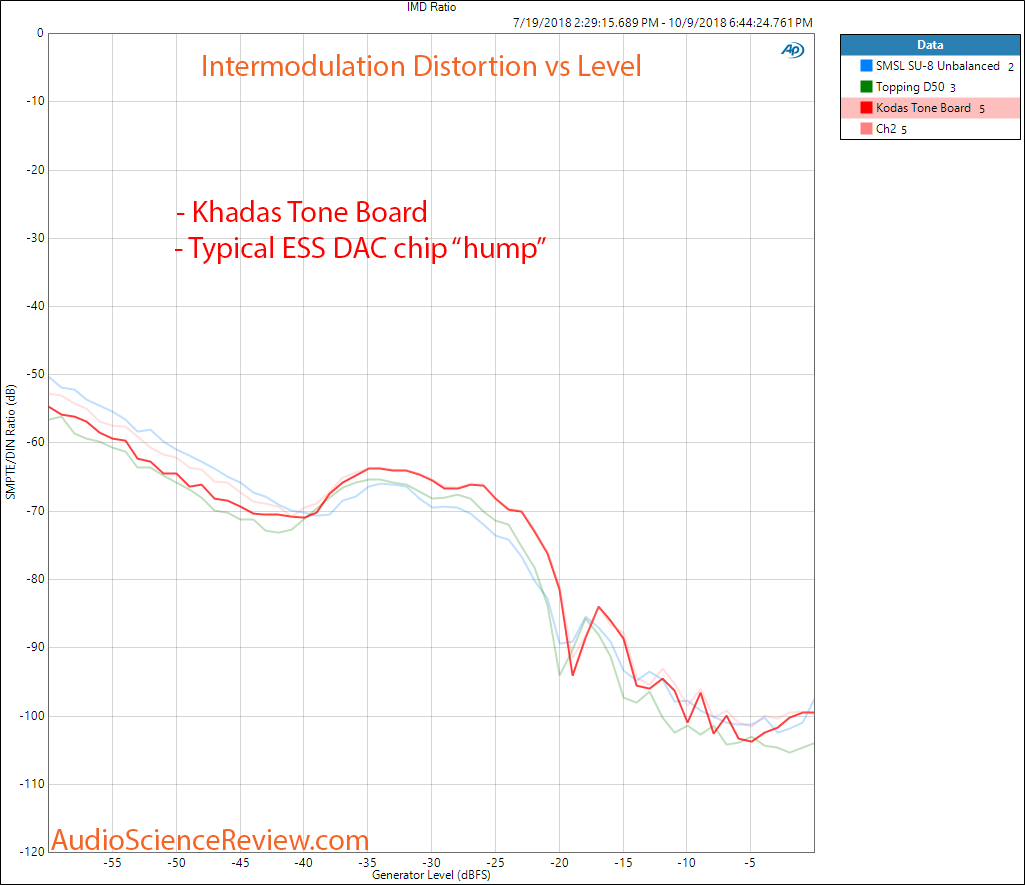
By now, we all know what the infamous "ESS Hump" looks like in the typical IMD vs. Level plot, as shown for example in Amir's original review of the WesionTEK Khadas Tone Board DAC (KTB). But it does also show up in simple THD+N vs. Level plots.
The DAC chip used is a ES9038Q2M.
I now have a KTB on loan from forum member in order to find out more about that Hump (and maybe even fix it).
Test Setup:
- PC is connected to an RME ADI-2 Pro which serves as the SPDIF source for the KTB and records the Distortion Spectra and Residual Waveform (what's left when the fundamental signal is notched out. The RME is operated fully isolated (USB and supply).
- KTB output goes to Audio Precision SYS-2322. KTB is supplied by a 5V cell-phone charger connected to the USB-C input of the board.
- The AP does the Signal Autoranging and the Fundamental Notch Filter as well as the make-up gain after the notch filter, the output of which then goes back to an ADC channel for capture/analysis.
- The AP also supplies an auto-ranging Signal Monitor signal to the other ADC channel, used for monitoring.
- REW is used to analyse the distortion spectra and the RMS noise floor.
- A helper tool for time-domain block-averaging and Adobe Audition is used to display the distortion residual waveform in raw and averaged (high resolution) representations.
- Test Frequency is 240Hz, an integer fraction of the 192kHz system sample rate (needed for the block-averaging. The fundamental has a period of exactly 400 Samples), and is is not conflicting with AC Mains frequencies.
- REW uses a 1Meg-point FFT with 8 averages to display the distortion spectra.
