• WANTED: Happy members who like to discuss audio and other topics related to our interest. Desire to learn and share knowledge of science required. There are many reviews of audio hardware and expert members to help answer your questions. Click here to have your audio equipment measured for free!

Analyze audio library for dynamic range and bass content?

jmf11

Active Member
Joined
Mar 25, 2023
Messages
101
Likes
47
Location
France - Aix en Provence
Hello,

In a journey to better understand parameters for audio systems design and/or selection, I would appreciate to perform statistics on the music I have, I listen to:
- dynamic range,
- How low it goes (bass content),
- possibly others...

Are there tools that would allow to do that on my whole audio library?

Best regards,

JMF
 
There may be a tool that you can set running as a batch operation to spit out results, but I'm not aware of one with that built in. Personally I use SOX a lot, and you could set up a powershell script to traverse your files with SOX.
 
Personally I would throw SciPy at this problem so I could work the data however I liked. Not for the faint of heart though! There seem to be many python libraries for reading audio files and very few of them without drawbacks.
 
You can analyze dynamic range with Foobar2000 and the dynamic range component. You can batch process multiple albums at one go. It can tag the DR readings directly to your file metadata and also create a separate .txt file within the album folder.
 
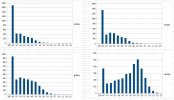
Based on pyMasVis, I adapted the python code (quick and dirty as only a basic and rusted coder) to extract for most of my tracks the spectrum for 20, 25, 30, 35, 45 and 50hz, and to plot the distribution. This gives something like below, on 3500 tracks of "my" music. First bar means that the Frequency is between -100 and -60dB. The 50Hz distribution peaks at -33dB and could be a sort of reference level.

In fact, there is more bass in my music than what I expected. 30% of my tracks would have some 30Hz at -12dB compared to 50Hz. Still 10% of my tracks would have some 20Hz at -12dB compared to 50Hz.

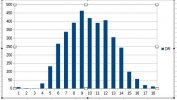
DR distribution is also attached.

Thanks @HenrikEnquist for pointing me at pyMasVis
 

Attachments

  • BassDistribution.JPG
    BassDistribution.JPG
    100.3 KB · Views: 59
  • DRdistribution.JPG
    DRdistribution.JPG
    36.9 KB · Views: 64
Please note that you don't have true dynamic range of your music. DR metrics rely on short-term averages to compute such numbers. To wit, if there is some digital silence at the start of the music, the dynamic range would be infinite which you never see in such tools. Of course that is not accurate either. The right method involves performing statistical analysis to find the true noise floor of the music and compare that to peaks. I don't know of a public tool that does this.
 
Thanks for the feedback,

In fact I'm not clear about which figures I should exactly look for and thresholds to consider.

I want to answer 2 questions.

1)If I listen to music at about x dB average, how much headroom I should consider:
- for the Speakers: datasheet SPL at desired max distorsion level,
- for the amplifier, considering the speakers efficiency and the needed headroom (crest factor, avoid too much clipping).

2)Considering the music I listen to, which bass extension I would reastically need and at about which SPL. This is to see if I can address with "simple" 5" to 7" monitors, or / and by how much a subwoofer is justified.

I can access all parameters from https://github.com/joakimfors/PyMas... Never Gonna Give You Up.spotify-pymasvis.png

Feel free to challenge or refine the wording: I'm here to learn.

Maybe this is more a topic for "General Audio discussions" now.
 
Back
Top Bottom