
-
Welcome to ASR. There are many reviews of audio hardware and expert members to help answer your questions. Click here to have your audio equipment measured for free!
You are using an out of date browser. It may not display this or other websites correctly.
You should upgrade or use an alternative browser.
You should upgrade or use an alternative browser.
72 software Sample Rate Converters put to the test
- Thread starter bibo01
- Start date
OP
bibo01
Active Member
- Joined
- Mar 10, 2016
- Messages
- 109
- Likes
- 20
- Thread Starter
- #22
Sorry, but I myself am in the best position to ask for Jussi's support.Mike, is there a way you can facilitate getting captured outputs of HQPlayer for this type of evaluation? I think it would be a very useful thing and I would imagine the developer would be in favor of it.
OP
bibo01
Active Member
- Joined
- Mar 10, 2016
- Messages
- 109
- Likes
- 20
- Thread Starter
- #24
Here it is the test with HQPlayer (thanks to Jussi's support):
GREEN = HQPlayer 3.13.x - Poly-Sinc-HB + TPDF dithering
RED = HQPlayer 3.13.x - Poly-Sinc + TPDF dithering
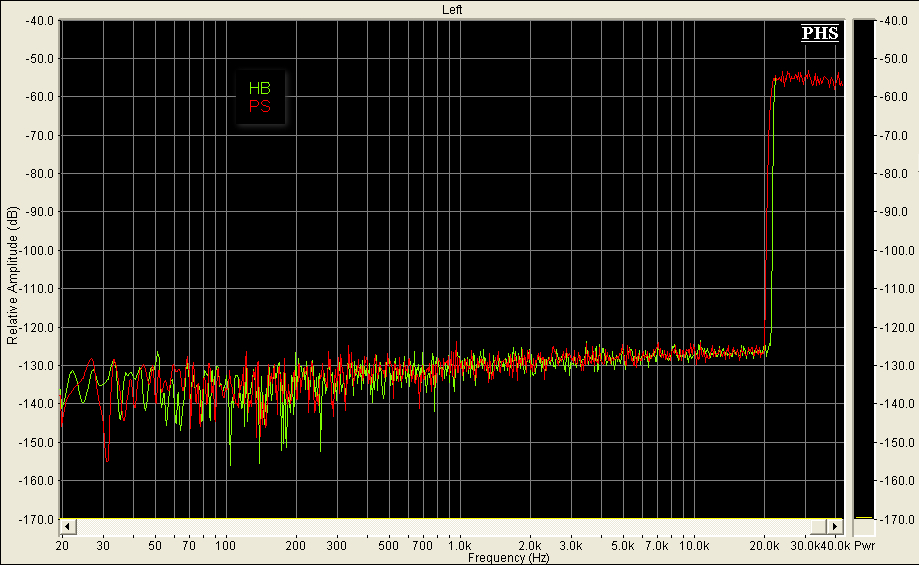
It is excellent. It is clearly among the best. In this application it seems that Poly-Sinc-HB is slightly preferable.
GREEN = HQPlayer 3.13.x - Poly-Sinc-HB + TPDF dithering
RED = HQPlayer 3.13.x - Poly-Sinc + TPDF dithering
It is excellent. It is clearly among the best. In this application it seems that Poly-Sinc-HB is slightly preferable.
Looks like Mike can let out the air he was holding waiting for these results ") . Thanks for doing this.
. Thanks for doing this.
. Thanks for doing this.John Kenny
Addicted to Fun and Learning
- Joined
- Mar 25, 2016
- Messages
- 568
- Likes
- 18
Excellent, bibo, but I'm not sure how you conclude that the green plot (HB) is preferable? To me, the red plot (PS) seems to have less excursions at frequencies below 1Khz even though it might be considered that red is also very slightly higher relative amplitude.Here it is the test with HQPlayer (thanks to Jussi's support):
GREEN = HQPlayer 3.13.x - Poly-Sinc-HB + TPDF dithering
RED = HQPlayer 3.13.x - Poly-Sinc + TPDF dithering
It is excellent. It is clearly among the best. In this application it seems that Poly-Sinc-HB is slightly preferable.
If I'm interpreting correctly what these plots mean - the higher plot line means slightly more divergence of the signal from the original so then the excursions of the green plot to lower relative amplitude mean less divergence at these frequencies. OK, I get it now - it's good to talk through these things

Last edited:
The green preserved wider bandwidth than red. The red seems to have truncated right at 20 Khz.
John Kenny
Addicted to Fun and Learning
- Joined
- Mar 25, 2016
- Messages
- 568
- Likes
- 18
I wasn't considering signals above 20Khz but I see what you mean. Whether they are of audible significance is another thing.The green preserved wider bandwidth than red. The red seems to have truncated right at 20 Khz.
Last edited:
Mivera
Major Contributor
Mike, is there a way you can facilitate getting captured outputs of HQPlayer for this type of evaluation? I think it would be a very useful thing and I would imagine the developer would be in favor of it.
I would just record clips from the analog outs of the PD2 played through Roon on my server. But I'm not sure if an Apx-555 can capture this data.
Mivera
Major Contributor
Here it is the test with HQPlayer (thanks to Jussi's support):
GREEN = HQPlayer 3.13.x - Poly-Sinc-HB + TPDF dithering
RED = HQPlayer 3.13.x - Poly-Sinc + TPDF dithering
It is excellent. It is clearly among the best. In this application it seems that Poly-Sinc-HB is slightly preferable.
Thank's for the results! But is there any tests that show the difference between the SDM modulators and filters?
Last edited:
Mivera
Major Contributor
That's for another thread
Perfect! I will eagerly await. I really want a clear understanding why this DSD7 256+ modulator is so good. The regular DSD7 is dull in comparison. Tube lovers might prefer it though.
John Kenny
Addicted to Fun and Learning
- Joined
- Mar 25, 2016
- Messages
- 568
- Likes
- 18
Yes, exciting stuff - can't waitThat's for another thread
John Kenny
Addicted to Fun and Learning
- Joined
- Mar 25, 2016
- Messages
- 568
- Likes
- 18
Is there any tool that can be used to overlay plots so that they can be switched between in A/B fashion - you know it's the best way to do comparisons.
OP
bibo01
Active Member
- Joined
- Mar 10, 2016
- Messages
- 109
- Likes
- 20
- Thread Starter
- #35
I would like to point out that an NTD is not a simple spectral analysis.
The FFT that I posted is just the display of the signal difference obtained from the comparison of the specular waveforms. Thus all possible and imaginable alterations are evidecened from this comparison.
Furthermore, the signal employed makes quantization noise analysis misleading because in that case pure sine tones are used.
In fact, if we use a pure 1 kHz sinusoidal tone the difference between WITH and WITHOUT dither comes out openly (no dither noise touches peaks of + 15db). This is NOT happening with pink noise (similar to music) as it is not affected by this action. (Anyone can try)
Here below the "typical quantization noise" which goes up when dither is NOT applied.
In GREEN with dither applied. (Substantially distributed noise with mean amplitude, higher but without typical peaks)
In RED with no dither.
The signal is a pure 1 kHz tone. (What you see is the residual noise)
John Kenny
Addicted to Fun and Learning
- Joined
- Mar 25, 2016
- Messages
- 568
- Likes
- 18
Correct me if I'm wrong but this is the FFT of the difference signal between original waveform & generated waveform (using pinknoise signal). Remind me again - the difference signal is achieved by you manually doing what AudioDiffmaker is supposed to do (but doesn't) - time aligning the two tracks at the start, reversing one track & subtracting it to give this difference trackI would like to point out that an NTD is not a simple spectral analysis.
The FFT that I posted is just the display of the signal difference obtained from the comparison of the specular waveforms. Thus all possible and imaginable alterations are evidecened from this comparison.
BTW, bibo, it would be great if you could provide downloads of individual plots as I'm finding some of the plots in o/p confusing as the colours are missing in some plots
Last edited:
Mivera
Major Contributor
May I ask what the hardware was used for this testing?
John Kenny
Addicted to Fun and Learning
- Joined
- Mar 25, 2016
- Messages
- 568
- Likes
- 18
Actually, I raised a point with Amir about audible significance of the plots >20Khz but another point comes to mind - who here considers these plots interesting but academic because they consider a signal differences of below about -90dB as not audible in music (most of these plots are < -90dB)?
Just to be clear, this is not my opinion but I'm wondering how many feel that way?
Just to be clear, this is not my opinion but I'm wondering how many feel that way?
OP
bibo01
Active Member
- Joined
- Mar 10, 2016
- Messages
- 109
- Likes
- 20
- Thread Starter
- #39
The measure taken was obtained after aligning the signals. However, one can also see the same alteration creating a tone with and without dither. The fundamental tone come out with all spurious harmonics that dither and without dither generate.Correct me if I'm wrong but this is the FFT of the difference signal between original waveform & generated waveform (using pinknoise signal). Remind me again - the difference signal is achieved by you manually doing what AudioDiffmaker is supposed to do (but doesn't) - time aligning the two tracks at the start, reversing one track & subtracting it to give this difference track
BTW, bibo, it would be great if you could provide downloads of individual plots as I'm finding some of the plots in o/p confusing as the colours are missing in some plots
Download for the signals can be provided.
Mivera
Major Contributor
Actually, I raised a point with Amir about audible significance of the plots >20Khz but another point comes to mind - who here considers these plots interesting but academic because they consider a signal differences of below about -90dB as not audible in music (most of these plots are < -90dB)?
Just to be clear, this is not my opinion but I'm wondering how many feel that way?
In my experience, if there's a measurable difference, and a audible difference, it's enough evidence for me to accept that there's a real difference.
Similar threads
- Replies
- 3
- Views
- 4K
- Replies
- 4
- Views
- 2K
- Replies
- 10
- Views
- 2K
- Replies
- 12
- Views
- 4K
- Replies
- 11
- Views
- 915