Yes, I agree with that. On which features matter more for preference, maybe it depends on listening volume and/or listening duration. I will stay tuned to see if this will get a definitive answer, it's a good question. I would prefer the Hps.com preference bands to be based on the two curves here rather than what they are using now.That target (SoundGuys) also has approximately 3 dB less energy in the 20-70 Hz area per the above graph. Which of the two areas with the most difference matters the most for preference rating?
I think we could equally conclude that (paraphrasing): “One big thing I take from this is that a target similar to Harman IE 2019, except slightly less V-shaped and slightly more tilted, is statistically tied.”
-
Welcome to ASR. There are many reviews of audio hardware and expert members to help answer your questions. Click here to have your audio equipment measured for free!
You are using an out of date browser. It may not display this or other websites correctly.
You should upgrade or use an alternative browser.
You should upgrade or use an alternative browser.
Was anybody at the Sean Olive talk at CanJam?
- Thread starter CaufieldSkeptic
- Start date
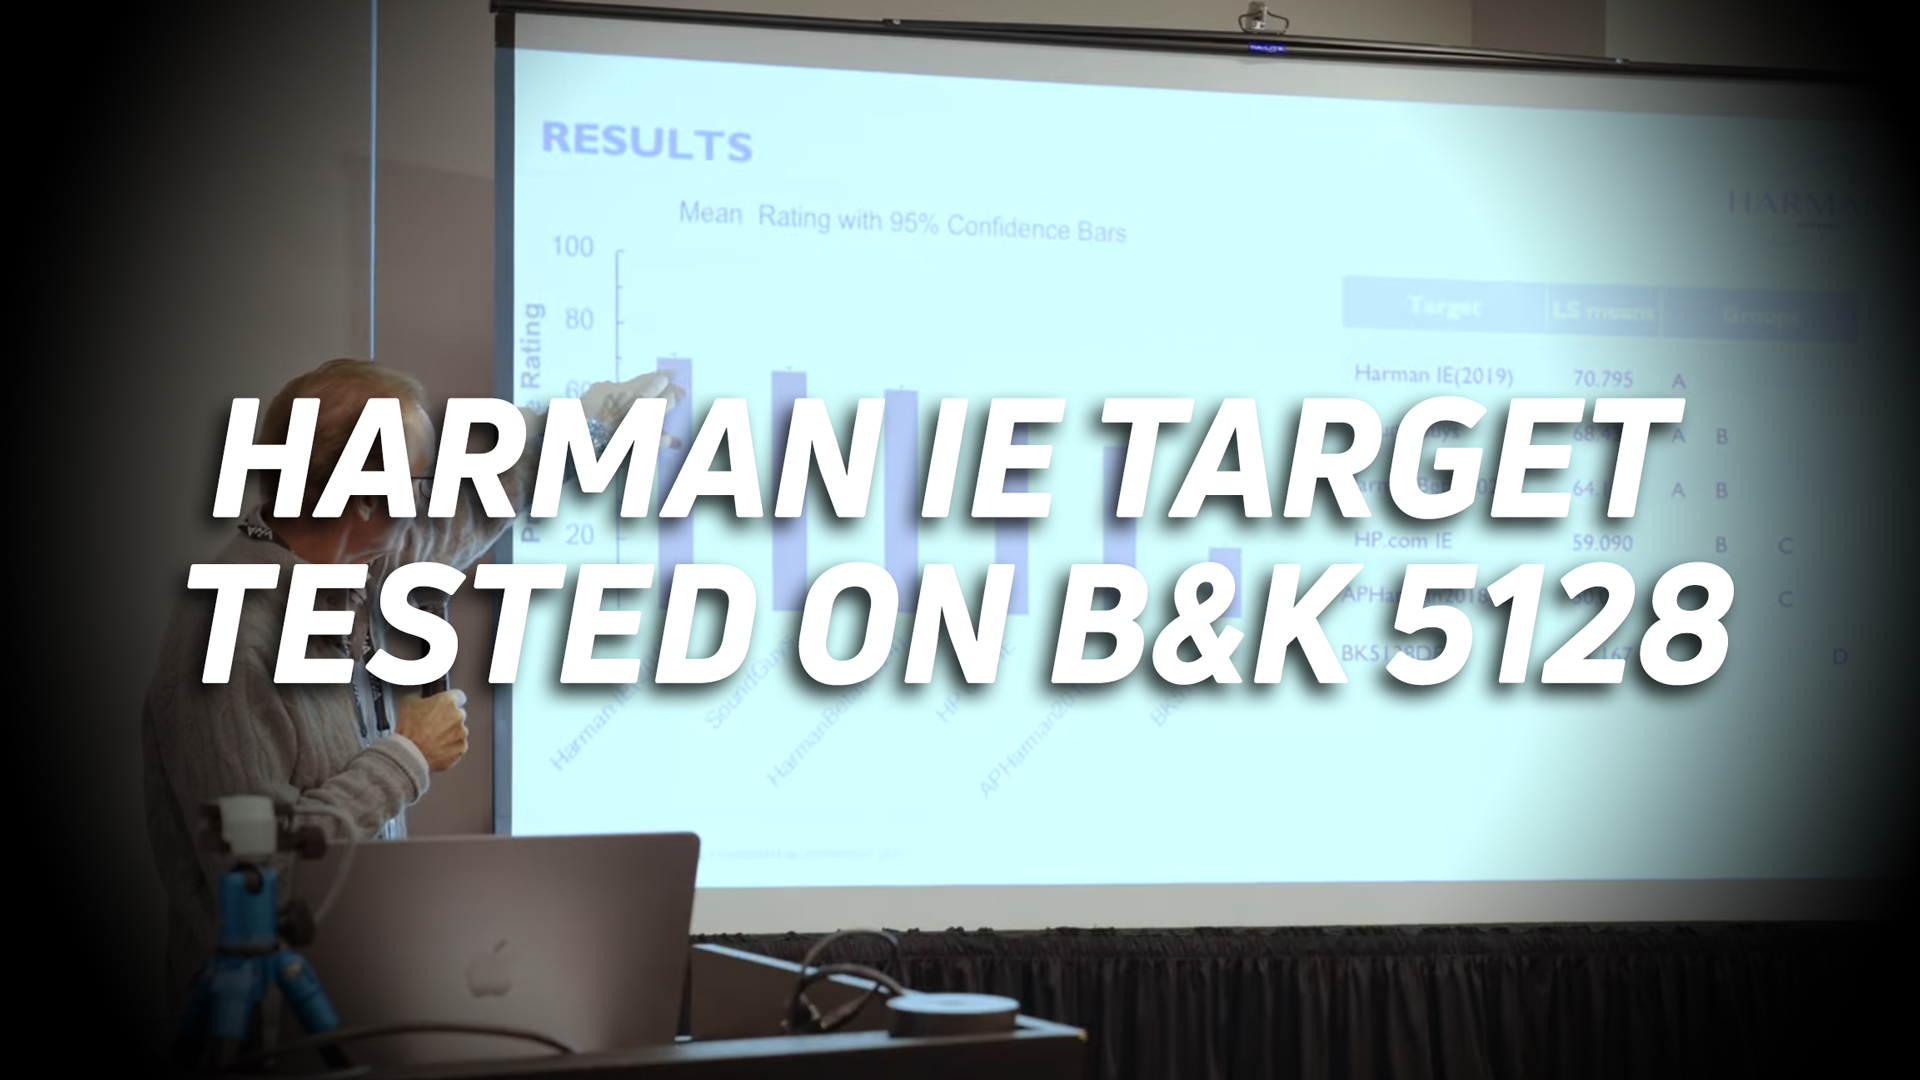
Harman research targets the Bruel & Kjaer 5128
For the first time, the Harman IE 2019 headphone response target gets tested on the leading test fixture for headphone measurements.
www.soundguys.com
I'd like to propose an informal listening test, partly inspired by this presentation. You will need a pair of Truthear Zero Red to do it.
I want to emphasise that I don't consider this a properly controlled and designed test, for reasons developed in that thread, but it could still prove useful to some of you to some capacity.
LINK
I want to emphasise that I don't consider this a properly controlled and designed test, for reasons developed in that thread, but it could still prove useful to some of you to some capacity.
LINK
Just to be clear. The BK5128 DF curve unmodified was the least preferred headphone target curve tested. This confirms previous listening tests where the DF wasincluded. It is too bright and thin, yet it remains the current standard and recommended target quoted in AES and IEC standards for the past 30 years.
The in-room measurements of the 19 loudspeakers is close to the DF target because the large number of sources coming from all directions approximate a DF and the speakers are equalized from anechoic flat to in-room flat meaning the speakers will also sound thin and bright.
If you apply a bass shelving and treble filter to the headphone matched to the flat in-room loudspeakers you can approximate the predicted-in room response of an anechoically flat loudspeaker. The downward slope of that curve is somewhere between 7-10 dB. There is a tolerance window around that target that will satisfy most people's taste. Some of the variance in taste is related to age (hearing loss), listening experience and possibly gender.
The HARMAN 2019 IE Target has a bass shelf boost and a treble shelf cut so is not DF tuned. The new HARMAN target we included in the test was the BK5128 DF with a bass and treble adjustment used in the HARMAN 2018 AE target: 6.6 dB bass shelf and -1.4 dB treble cut -- so it was not DF. I called it HARMAN Beta 2024 because it has not gone through any method of adjustment experiments where listeners modify the bass/treble to according to taste.
Fwiw, I agree that the sloped in-room response of a good loudspeaker tends to be around -7 to -10 dB in total. Or about -0.7 to -1.0 dB per octave.
I still think a steeper slope will be needed though to approximate the sound of the Harman 2018 over-ear curve, when using diffuse field as the starting point... probably something more along the lines of a sound power curve in the -1.0 to -1.5 dB/octave range. I suppose it depends to some extent though on how the DF curve is actually measured or derived.
This approach seems to work pretty well with HBK's original 1/3-octave 5128 DF measurement, for example, up to about 16 kHz*. But less well with the free-field derived DF curves referenced in this presentation, and currently used by Headphones.com.
Over-ear headphones that measure close to the Harman 2018 over-ear target on GRAS rigs compare pretty favorably in terms of their overall response to HBK's 1/3-octave 5128 DF curve with a sound power slope when the headphones are measured on a 5128 rig. So this is still the best model for the Harman target (and a neutral response imho) that I've found so far for the 5128.
I think there are still some problems using a DF based approach though with rigs that are based on a flat plate. And would favor an approach that is based on speakers with a flat direct sound (rather than flat in-room) in a typical triangular formation (spatially sampled) in a semi-reflective room, measured inside the ears of a HATS/mannikin.
(*Above ~16k, HBK's 1/3-octave DF is too bright overall and low in resolution to really be accurate or useful imo.)
Last edited:
I wonder also if some of the data in the 5128 Senselab study in this presentation was ever revised or updated, since the best rated curves looked rather bright in the treble, and perhaps also a little too withdrawn in the upper mids (around 2 to 3 kHz). There are quite a few newer headphones that are more withdrawn in the upper mids though, and many that have a pretty substantial "BBC dip" there. So perhaps the study was a bit skewed toward that type of sound based on some of the headphones that were used.
I don't think that would explain the preference for the brighter treble though. If there is any further followup on this, it would be interesting to hear.
I don't think that would explain the preference for the brighter treble though. If there is any further followup on this, it would be interesting to hear.
Last edited:
This approach seems to work pretty well with HBK's original 1/3-octave 5128 DF measurement, for example, up to about 16 kHz*. But less well with the free-field derived DF curves referenced in this presentation, and currently used by Headphones.com.
A small correction to my previous post above. The units that are designated on the 1/3-octave HBK 5128 DF graph above appear to be more or less correct. But the logarthimic grid appears to be shifted too far to the right, so the beginning of each decade is (incorrectly imo) aligned with the 20, 200, 2k and 20k Hz units shown on the graph.
The same type of error can also be seen in the DF/FF graph in Figure 3 of HBK's 5128 datasheet.
The DF curve appears to be more correctly plotted on Amir's 5128 graphs here. However a small bit of the lower portion of the frequency range (below about 25 Hz or so) is missing from these graphs....

Headphone Measurements Using Brüel & Kjær 5128 HATS
This is an investigation thread into feasibility of ASR adopting the Brüel & Kjær Type 5128 "high-frequency" Head and Torso Simulator (HATS). It is on kind short-term loan from the company. As configured, it costs around US $41,000. This is quite a bit more money than competing solution...
www.audiosciencereview.com
Last edited:
I am curious, how does this "mapping" work?But did Sean Olive not present the "mapping" of the G.R.A.S. Harman target to the 5128 Harman target in the talk?
I got a 4128 vs 5128 measurement data of the same headphone, and I tried generating a "4128 data compensated by 4128 DF", and multiply that same "measurement : DF" ratio to the 5128 DF curve, the result doesn't match at all with the 5128 measurement. So DF based math won't really work I guess.
What I can think of that would probably work is, get a low distortion headphone, measure it with the same old GRAS fixture, EQ it with highest precision possible to the Harman 2019, measure again with GRAS making sure it indeed is the same as the target measured by the old GRAS fixture. Now take the EQed headphone and measure it with 5128, the result should be the actual Harman 2019 for 5128 fixture.
Am I understanding it correctly? Is this how the "mapped" version of the curve was produced? Or how did they do it otherwise?
I think I found the answer.Am I understanding it correctly? Is this how the "mapped" version of the curve was produced? Or how did they do it otherwise?
Basically yes, the "translation" does involve re-measuring an IEM.
Andysu
Major Contributor
- Joined
- Dec 7, 2019
- Messages
- 4,103
- Likes
- 2,287
but what of skywalker sound ( your visiting no pictures ? they ain't special take pictures video what have they got to hide ? ) it sounds overrated , the foley there is dreadful sounding , maybe why makes the headphones and JBL speakers sound exaggerated fake harsh soundingListening test design here:
My observation is that there is no single equivalency between frequency response and what live music "sounds like." Music is performed in many different environments, mainly differing in acoustics - size and reverberant field. You can't directly measure the frequency response of a hall and just apply that. If you pay strict attention during your next live concert, the bass is very impressive but frequency is not what is responsible for that; when the drums are whacked the sound spreads out to the entire space in a most impressive way - something we can't duplicate in a small playback room. So to attempt to compensate we increase the bass response until we are happy, and that depends on the acoustics of our rooms. I don't know how all that translates to headphone listening, where the playback room is removed, except that all we can do is adjust to taste by experience.
Moral: There is no "correct" curve in either speakers or headphones - just realize that injecting more bass tries to simulate the spatial characteristic of live sound.
Moral: There is no "correct" curve in either speakers or headphones - just realize that injecting more bass tries to simulate the spatial characteristic of live sound.
You’re correct… but what is perceived as “poor spatial qualities” is often due to lack of (some) treble frequencies.My observation is that there is no single equivalency between frequency response and what live music "sounds like."
Also correct… but it doesn’t mean that any random curve is good or desirable—a path often walked by audiophiles. Some curves have a better chance to be liked by most, others are going to be liked by very few!Moral: There is no "correct" curve in either speakers or headphones