• WANTED: Happy members who like to discuss audio and other topics related to our interest. Desire to learn and share knowledge of science required. There are many reviews of audio hardware and expert members to help answer your questions. Click here to have your audio equipment measured for free!

Spatial variance of harmonic distortion?

617

Major Contributor
Forum Donor
Joined
Mar 18, 2019
Messages
2,434
Likes
5,386
Location
Somerville, MA
I was reviewing the mechanism by which the Klippel NFS derives harmonic distortion measurements, and it appears that it does so simultaneously with the frequency response measurement. In other words, the data derived from the multi-distance measurement set can be used to generate plots of frequency response and harmonic distortion, presumably limited of course by the sample rate.

This raises an interesting possibility, however - the system should be able to show relative harmonic magnitudes as a function of space - distortion directivity. This could be represented in a plot similar to directivity, but showing H2 or H3 or whatever harmonic is desired.

I was wondering one, if @amirm knew if the NFS could generate reports of this data, and two, if anyone had seen any data indicating that HD magnitude changes with respect to measurement position? Obviously, one would expect that at low frequencies, and probably midrange, harmonic distortion would be a stable % of total output, and would 'track' the falloff of the drivers, but I wonder if there could be off-axis peaks in harmonic distortion, produced for example when drivers are entering breakup.

Curious if anyone has seen any data on this. @ctrl, @NTK.
 
OP
617

617

Major Contributor
Forum Donor
Joined
Mar 18, 2019
Messages
2,434
Likes
5,386
Location
Somerville, MA
OP
617

617

Major Contributor
Forum Donor
Joined
Mar 18, 2019
Messages
2,434
Likes
5,386
Location
Somerville, MA

Curvature

Major Contributor
Joined
May 20, 2022
Messages
1,116
Likes
1,410
One other interesting finding is that one driver had a strong resonance, which was high in amplitude and nearly omnidirectional. Probably why they are so audible.
 

NTK

Major Contributor
Forum Donor
Joined
Aug 11, 2019
Messages
2,716
Likes
6,007
Location
US East
This raises an interesting possibility, however - the system should be able to show relative harmonic magnitudes as a function of space - distortion directivity. This could be represented in a plot similar to directivity, but showing H2 or H3 or whatever harmonic is desired.
I haven't had a chance to read the papers mentioned upthread yet. However, from what I understand of the NFS process I'd think generating information on the spatial distribution of the distortions should be (IMHO relatively easily) doable.

I'll start by giving a quick introduction on how the harmonic distortions are obtained using the logarithmic (exponential) sine sweep, so that members unfamiliar with the technique may get some idea. The slides shown are from this presentation by Professor Farina: http://pcfarina.eng.unipr.it/Public/Presentations/aes122-farina.pdf
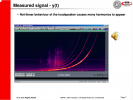
  1. Here is an example (spectrogram) of a measured sweep. The lowest trace shows the fundamental, which corresponds to the excitation signal (the frequency of input sweep at any given moment of time). The traces above the fundamental are the distortion harmonics. As they are harmonic distortions of the input signal frequency, the frequencies of the HD traces are at 2x, 3x, 4x ... that of the fundamental.

    sweep_1.png

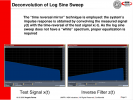
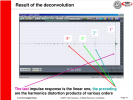
  2. A unique characteristic of the logarithmic sine sweep signal is that through some mathematical manipulations, one can separate out each of the harmonics from the fundamental. Using the "time reversal mirror" technique, the harmonics can be time shifted from the fundamental and separate out in the impulse response (inverse FFT of the complex frequency response). The impulse responses of each of the harmonics can then be extracted using time gating windows. Apply FFT to each of these impulse responses will get us their frequency domain representations and thus the harmonic distortion traces.

    sweep_2.png sweep_3.png
I don't know if the Klippel NFS software include the functionality, but I also don't know of anything that will prevent anybody from feeding the impulse responses for each harmonic to the NFS algorithm (instead of those of the fundamental) and apply the same processing. We should be able to obtain directivity balloons and all the other curves.

Though I am not sure how useful those curves are going to be. Nonlinearity means you can't extrapolate, which means measurements at the standard 2.83 Vrms input (for passive loudspeakers) will not tell us much if we double the input voltage (other than it should be worse). We will need to run another full set of scans if we want distortion data at other input (or output) levels.
 

MaxwellsEq

Major Contributor
Joined
Aug 18, 2020
Messages
1,750
Likes
2,645
I've not seen this before. Very interesting, thank you!
 
  • Like
Reactions: NTK

fredoamigo

Addicted to Fun and Learning
Forum Donor
Joined
Mar 11, 2018
Messages
638
Likes
1,123
Location
South East France
Top Bottom