• Welcome to ASR. There are many reviews of audio hardware and expert members to help answer your questions. Click here to have your audio equipment measured for free!

multitone spectrum proposal

solderdude

Grand Contributor
Joined
Jul 21, 2018
Messages
18,001
Likes
41,506
Location
South Holland
I know my proposal is not a standard and maybe even nonsensical but here it goes.

Did some dgging into spectra of music in AES papers and other research (also from MQA Bob) and found quite a lot of data on the spectra of music. Even across various genres which do have some differences but aside from bass levels do not differ that much.

Anyway.. as is well known music spectrum is closer to pink noise than white noise. Yet... the multitone signal is basically 'white noise shaped' in peak levels.
So was wondering how multitones would look like if the stimulus would be more 'pink noise' in spectrum or maybe even more like the spectrum below.

As music is not about average levels but more about impulses and peak levels (which multitone looks like as a signal) I found the 'average level' research to be close to the green line I drew in below.
But in the research for peak levels (which is what music is more about) I found a similar slope but about 20dB higher in level and a decade higher in frequency.

proposal multitone.png

Of course in reality the low bass levels differ (per genre mostly) and above 10kHz the drop is steeper.

The question (mostly to @amirm) is would it make sense to shape the multitone in spectrum in a similar way (to get closer to audio content) ?
 
Last edited:
Think about if the tones chosen took into account ear sensitivity vs frequency. I think the even whitish level makes sense for that reason because of where IMD products would cluster.

Maybe your slopes combined with Fletcher Munson curves.
 
Think about if the tones chosen took into account ear sensitivity vs frequency. I think the even whitish level makes sense for that reason because of where IMD products would cluster.

Maybe your slopes combined with Fletcher Munson curves.
That could be interesting as an overlay over such plots.
The problem is where to put the 0dB reference as that would depend on the max available signal level + transducer sensitivity and for speakers listening distance/room effects.
Most of the 'energy' is in the lower frequencies but even when the total output would result in say 120dB peaks the combined signal level of that 120dB peak SPL would be much lower than the 0dB line. From that point the FM curves would be overlaid.

Could be an interesting overlay if one can agree on where to place the reference for SPL and thus where the 0 Phon curve would be (as that would be the most interesting line for audibility threshold.

My idea was that the 19-20kHz IMD says a lot but in music there will never be such a signal.
Similar as there will never be music with 20kHz at the same level as 200Hz.

It is likely that the 'grass' we see (the IM products) might not even change that much. Just wondering if that would happen and how easy it would be to generate such a spectrum and how the results differ with 'white noise spectrum' plots.
Most likely only some of the 'grass poles' might be a little lower in which case it is moot.

Still... it is O.K. to test for those aspects and am all for that. It just makes less sense for it to say something about actual music which, in the end, is what audio is all about.

Hence my proposal (as a separate graph, maybe include FM curves as overlay to get a better grasp about the audibility of it all in practice.
As said ... the caveat would be where to place the reference for the 0 phon trace as that would depend on several aspects that are unpredictable.
 
I like the idea! But...
  1. The peaks all peaking at 0dB is a good visual indicator for flat frequency response.
  2. The test might be more realistic, but I think for most cases, it’s less demanding.
I personally prefer a test that is unrealistic if it is on the side of "harder" or more demanding for the tested equipment.

Therefore, I like the old multi-tone test.

Of course, I wouldn't argue against an addition of this test, but maybe it should be evaluated to see if this makes a significant difference.

What I would like to see is a better (automated) quantitative analysis of the multitone test results. One approach could be a summation of the differences between the input and output, similar to a 'nulling' test.
Alternatively, a 32-peak (digital) comb filter could be used to analyze the THD+N content in the multitone signal.

Like SINAD but not based on a single 1k tone test but based on a multi tone signal
 
That was my point..

Testing equipment at the peak and to well known standards is a good thing.
My question was more or less born from the 'comments' that ask for a more 'music alike' signal to test with.
Multitone is just that but compared to 'music content' it isn't as realistic.

I suspect there won't be much difference in the 'grass' with the 'red' spectrum proposal but there might be with the 'green' proposed spectrum.
It would have to be an additional test, maybe founded on 'proven science' and would mean more reporting, more explaining etc.
So.. I was just wondering how much difference there would be when the 'artificial spectrum' results would be if the spectrum was more akin to 'music'.
 
I agree about your spectrum being more tuned towards audibility, but measuring electronics is not so much about audibility and more about technical information (Testing max power at 20kHz i.e.). So the "standard" multitone is just as good and maybe even better, because it is more demanding and more "telling" about the details of electronic function.

For a speaker (or HP) this would be different and a "pinkish" test would be appropriate for IMD measurements.
 
Average frequency spectrum of music:
statistique-spl_1235588.jpg


Source: https://www.researchgate.net/public...d_its_Relation_to_the_Level_of_the_Percussion


There are multiple norms / standards that try to replicate that spectrum; displayed in the following graph as the black curve CTA 2034A, red IEC 60268-21, blue EIA-426B:

spectra.png


IEC 60268-21 is probably the most accurate, even though all are close enough imo. Either way, no need to create a spectrum yourself - it has already been done.
 
The question (mostly to @amirm) is would it make sense to shape the multitone in spectrum in a similar way (to get closer to audio content) ?

Oh, and that is also already being done - even though much too rarely.

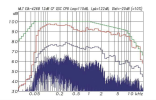
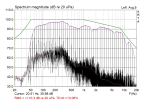
Attached is at the left a multitone measurement of a QSC CP8 speaker by the German magazine Production Partner (embedded for research purposes; fair use clause applies), taken by Prof. Dr. Anselm Goertz with his Monkey Forest software. To the right is my measurement of the same speaker under the same circumstances with ARTA. The frequency shaping applied was EIA-426B (green curve); the resulting frequency response in red (Production Partner) and purple (mine); and the distortion products below that.

3.png 4.png
 
I think this is a good suggestion but if I had to pick one, I'd pick the standard multitone. It gives a "worst case" distortion measure, where the modified spectra give more of a "typical use" measure. I think that's also quite informative, but I think the former is more important to know if you're buying electronics.

The people who say "but what about actual music, I don't listen to tones" believe music is more demanding then test signals, not less, so I doubt changing the amplitudes of the tones is going to make them realize it's more music-like.

That said I think there is something here... music-modulated test signals plus audibility thresholds equals something like SINAD but with a deeper connection to realistic use cases?
 
Some of my previous articles include signal weighting based upon equal-loudness curves (the revised Fletcher-Munson, Robinson-Dadson, now ISO-226 curves). For a number of things, like spectral analysis of loudspeakers and assessing musical signals and such for power needs, I like them. For basic component testing, not so much, because the components are specified to have rated performance over the entire frequency range anyway. It is much easier to generate and analyze (see) the results using equal-amplitude signals. To me, equal-loudness weighting makes the results visually much less intuitive since various signal frequencies (fundamental and distortion products) will be affected by the weighting, making it hard if not impractical to judge the results.

One could argue that is good, of course, since e.g. harmonics that are weighted lower because we are less sensitive to them (or vice versa) now follow our natural listening curve. One obvious counter is that not everyone has the same curve, even young folk, and high frequency roll-off is more pronounced for us old farts, so what exactly is the proper curve? I'd rather just have a flat curve for testing and extrapolate for myself.

A simple pink noise roll-off could be interesting, and is a common test signal, though to me would be an additional test for @amirm to run and he is already swamped with work.

Interesting topic - Don
 
Attached is at the left a multitone measurement of a QSC CP8 speaker by the German magazine Production Partner (embedded for research purposes; fair use clause applies), taken by Prof. Dr. Anselm Goertz with his Monkey Forest software. To the right is my measurement of the same speaker under the same circumstances with ARTA. The frequency shaping applied was EIA-426B (green curve); the resulting frequency response in red (Production Partner) and purple (mine); and the distortion products below that.
Yes, Prof. Goertz uses it also in the Sound & Recording studio monitor tests and I have "inverse engineered" a similar one which I also use when I do multitone distortion measurements since a long time.
 
Oh, and that is also already being done - even though much too rarely.

Attached is at the left a multitone measurement of a QSC CP8 speaker by the German magazine Production Partner (embedded for research purposes; fair use clause applies), taken by Prof. Dr. Anselm Goertz with his Monkey Forest software. To the right is my measurement of the same speaker under the same circumstances with ARTA. The frequency shaping applied was EIA-426B (green curve); the resulting frequency response in red (Production Partner) and purple (mine); and the distortion products below that.

View attachment 435723 View attachment 435724
Yes, for speakers (and even headphones) this makes sense.
I have seen them used for that.
With transducers one also has to consider the mic/room/fixture.

Have not seen shaped multitone used for electronics.
I was wondering what the difference would be with amps and DACs for instance compared to the normal multitone in the final result of the 'grass'.
Especially for class-D amps with their rising distortion in the treble and IM it might give different results that might 'resonate' better with the 'but test signals don't look like music' crowd.

Of course it could well be shaped acc to standards, pink noise shaping but indeed would require extra measurements/reporting and clarification/and or target lines drawn in to the plots which is not needed with regular multitone.
One minor point: almost all amplifiers (not just class D) have rising distortion as frequency increases due to reduced feedback (lower loop gain). IMD tracks HD so both rise with frequency, though high-order products (HD or IMD) are affected by the overall bandwidth.
 
yep, but usually class D (certainly the cheaper ones) are a bit worse than the non-switching amps.
 
yep, but usually class D (certainly the cheaper ones) are a bit worse than the non-switching amps.
That I did not know, don't really follow amp specs these days (sacrilege here, but oh well), have to bow to your experience. Most modern class D amps have much greater feedback than class A or AB "linear" amplifiers, and greater bandwidth due to their self-oscillating design, but I have not followed the lower-end class D amps (nor really even the higher end ones save reading about them here, spend more time on other forums these days). Still, finite bandwidth, finite loop gain, means rising distortion at high frequencies no matter the amp class.

Curious, though, why is it worse for the class D amps you have seen? From a circuit/engineering viewpoint. Do not doubt you a bit, just wondering what's going on, and if it is endemic to class D for whatever reason.
 
Possibly the switching frequency and filtering. It seems to go hand in hand with HF peaking as well.

all low in distortion/SINAD but multitone isn't great. There are some cheaper exceptions though.

1741935799576.png


1741935829251.png


1741935848405.png


1741935871689.png
 
Last edited:
... music is not about average levels but more about impulses and peak levels (which multitone looks like as a signal) ...
Solderdude: This looks like a very interesting idea. The plot "proposal multitone.png" appears to be right on point. The "AP)" in the upper right would imply that it relates to an actual test signal.

1) How was the test signal generated?
2) How were the results of the test analyzed?
3) Alternatively, if this relates to another thread, please supply the relevant link.

I will share some additional thoughts afterwards but don't want to be overly duplicative.

Thanks.
1: it was a proposal, generated using MS paint
2: there was no analysis
3: I just took one of the plots made by Amir and changed it.

It was just a simple test proposal based on average spectrum of music I found scouring the web and publications.
Much simpler than the more 'accurate' CTA 2034A, IEC 60268-21 and EIA-426B standards (which I did not know existed) and visually easier to look at while having a spectrum closer to 'average music'.
Of course a point was made that the current one was more rigorous as it tests limits. My question was what would the final result look like when there is less 'treble' as in music there is less as well.
 
Last edited:
Thank you very much. I have been putting in some time on a very similar testing idea. Your proposal is very 'in band' which overcomes a lot of potential objections. It has way more 'muscle' than the common SMPTE test.

I was directed to the article "Spectral Contamination Measurement" written by Deane Jensen in 1987-88 (Published "85th A.E S. Convention---November, 1988") - that got me started. The method he used was more like a CCIF test. Sadly, that is not so 'in band'.

"We are using this measurement in an attempt to further our understanding of some types of distortion which have been called "MID-RANGE SMEAR" or "GRUNGE". We are also trying to develop objective measurements which correlate with subjective impressions of sound coloration."

I have been noticing a lot of grunge in a variety of source material myself lately. It worries me because I don't know why or how to remove it yet.

I hope that this thread elicits additional responses. The design of a test which would eliminate the test signal from the output of the 'Device Under Test' and directly display only the distortion elements will be quite complicated.
 
Back
Top Bottom