• WANTED: Happy members who like to discuss audio and other topics related to our interest. Desire to learn and share knowledge of science required. There are many reviews of audio hardware and expert members to help answer your questions. Click here to have your audio equipment measured for free!

How to measure phase properly at home using REW?

OP
Krunok

Krunok

Major Contributor
Joined
Mar 25, 2018
Messages
4,600
Likes
3,067
Location
Zg, Cro
But the fact that the group delay is around 80 ms at 130 and 170 Hz is a bit worrying. Except if these parts are at the bottom of dips in the amplitude response curve, as it is often the case. Then it doesn't matter, since these frequencies are nearly silent.

They are bottom of dips. Btw, I based my amplitutude correction on MMM RTA pink noise which averaged those narrow dips.

Here is how single sweep looks from LP:

Unsmoothed (I don't know if it is normal that it is so "choppy")
FR.JPG


with 1/12 smoothing
FR_12.JPG


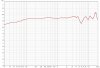
But if I take 9 measurements sweeps around my listening sofa and average them you won't be seeing these peaks.
It would look like this (unsmoothed):

FR.JPG


What's the sweep size used as a test signal ? For phase and GD measurement from the listening position, I think that the longest one is best (1M). In any case, the length of the test signal has a clear effect on this graph.
I don't know if the fact that the microphone is perfectly still during the measurement matters.

512K. I was holdig mic by hand.

So here, we have the group delay of only a part of the sound : the direct sound and its first reflections (it's completely anechoic only below, say, 1ms, that is only above 1000 Hz in this graph).

It's a bit difficult for me to understand what it means. I can understand what means the amplitude response with Frequency Dependant Window. It's the tonal balance of the attacks in the sound, with reverberations in the room left aside. I can imagine the spectrum changing with time, and being different in the first milliseconds, while we are hearing the direct sound of the speaker, then changing as the sound decays, while we are hearing the sound of the room.

But phase changing as sound decays ?
If I understand correctly, it gives an idea of the time coherence of the attacks that reach our ears before the sound begins to decay in the room.

The two previous peaks, at 130 and 170 Hz, are still visible here, reduced in amplitude. But we can't tell if they come from the direct sound (then it matters, as this represents the time coherence of the speaker) or from the first reflections in the room, that the 12 cycle windowing includes.
In the later case, they should be ignored, as they are just remnants of the peaks in the initial graph, not completely canceled because of the too wide windowing.

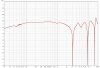
I believe those peaks are not coming from direct sound but are caused by first reflections as they vanish when I reduce # of cycles in FDW.

Here it is how it looks with 1/6 cycles, no smoothing:
GD_6cycles.JPG


3cycles:
GD_3cycles.JPG
 
Last edited:
OP
Krunok

Krunok

Major Contributor
Joined
Mar 25, 2018
Messages
4,600
Likes
3,067
Location
Zg, Cro
I have made some videos with random phase distortion. Unfortunately, all examples include pre-echo, which prevents to hear group delay alone, as pre-echo is much more audible. But anyway, here they are.
Listen to them with headphones, to avoid the group delay of your room masking everything.

Why do you think group delay of my room will mask anything as I corrected it at the LP? Those GD graphs are recorder at LP so they contain GD of speaker + GD of room at LP.

I have made some videos with random phase distortion. Unfortunately, all examples include pre-echo, which prevents to hear group delay alone, as pre-echo is much more audible. But anyway, here they are.
Listen to them with headphones, to avoid the group delay of your room masking everything.


In the first part of the video, the effect of amplitude alone is heard. Since the transformation is not minimal phase, an awful lot of pre-echo is audible in low frequencies.
In the second part of the video, the effect of phase alone is heard. Again, a lot of pre-echo can be heard in the bass.

This second video is a bit more intersting :


Here, the same random amplitude distortion as in the first video is added to the sound, but in two different versions, minimal, and linear phase alternately.
Although the pre-echo of the linear phase version is still obvious, we can also hear that the bass rhythm is slightly offsetted in time. This is the audible effect of group delay alone (+74 ms here).

The raw group delay curve of the linear phase example is this :

View attachment 46830

It peaks around 25 ms (it should have been flat, but the actual corrections are not perfectly accurate).

The group delay of the minimal phase version is that :

View attachment 46829

And the effect of this narrow peak of group delay is audible in itself, I think (although I can't prove it, since the delay alone can't be separated from time smearing).
If the musical beat had been perfectly centered around the frequency of 54 Hz, it would have been delayed by 100 ms. But since it is not exactly at that frequency, we can measure, on the musical waveform, that the actual delay is 74 ms only.

What I'm meaning is that what we can see, and hear in this example is a 74 ms delay in time, and this is only visible in the group delay graph when it is not smoothed.

Well, i can hear the difference when listening to the speakers, especially on 1st part of 1st video - that one is extremely boomy and with attenuated highs. Bass on second one sounds shallow.

Btw, electronic bass on the songs I listen doesn't sound anything like that. I tested bass response with Focal Test CD No2 and drums and bass guitar sound very natural. My older son who play guitar in the band also agrees to that and as they practice often I trust that he knows how drums and bass guitar should sound in the room.

Later, I started from the minimal phase version of the distorted file, and applied two reverse filters : one linear phase, and one minimal phase. This time I was able to compare the temporal effects without pre-echo in any of the two files. I must have these files somewhere on my hard drive. I ABXed them with a score of 16/16.
But the main audible difference was not the delay, it was the overall time smearing. Although there was no pre-echo, and all the bass was delayed after the initial attack, the time smearing was still audible. It was easier to focus on it than on the delay to pass the ABX test.

I would very much appreciate if you can find those files and send it to me. :)
 
Last edited:

Hayabusa

Addicted to Fun and Learning
Joined
Oct 12, 2019
Messages
834
Likes
575
Location
Abu Dhabi
When trying to do room EQ measurements with REW you will find a lot of information on the Net. You have option to do RTA measurement with pink noise using moving microphone method. Another option is to make several sweeps at and around your LP and use "Average the response" feature under All SPL tab. If you want to preserve timing information you can rely on a single sweep or use Vector average (although that one tends to result in a weird frequency response, but there you have it).

However, with phase measurements things are getting a little tricky. let's assume for simpicity you have a done a single sweep and that it contains accurate info. You fixed the IR delay and your phase is shown wrapped in REW. But what now?

At the very beginning you will soon realise that it gets much harder to get phase response displayed correctly in REW as your distance between microphone and speaker gets bigger. If you measured from 10cm distance chances are you would not need to apply any gating and/or frequency dependent windowing to show pahse correctly.
If you measure from 0.5m or 2m you will probably need to make some adjustments under IR Window settings to get the phase displayed properly. But if you measure from your LP whivh is say 4 meters from your speakers and reflections in your room are pretty high you may realise that displaying phase correctly presents quite a challenge.

This is how it looks when I do it in my room with my left speaker, measured from app 2m, no gating:


With right window of 3ms (doesn't display correctly with higher value):


With FDW of 3 cycles (doesn't display correctly with higher value):


Here I would like to say that when I measure phase from 10cm no gating nor FDW is required to display phase correctly. As measuring distance increases the reflections are building up so I have to apply more and mroe gating to display phase.

Phase overlayed (3ms vs FDW 3cycl):


Step overlayed (3ms vs FDW 3cycl):


GD overlayed (3ms vs FDW 3cycl):


So, after all of these graphs a few question arises, like for example:

- what is the optimum distance to measure phase in your room? Very close to the speaker, say 10cm, or at your LP?
- what is the optimum way to adjust your measurement? Applaying right window time gating, FDW, or both?
- should we even bother with all this? Does getting the phase flat matters at all?

I would like to add here that, when i was doing manual correction of my room/speakers response I didn't rely much on measuring uncorrected phase response. Once I fixed amplitude response in rePhase I corrected phase of my filters so it would be as close to 0 as possible to stay minimum phase and I entered data about my crossover (LR 24dB/oct at 1800Hz) so the rePhase can take it into account. The graphs above are showing the results of that.

What about the "generate minimal phase" option in REW?
I thought it would correct the phase difference caused by the measuring distance?
 
OP
Krunok

Krunok

Major Contributor
Joined
Mar 25, 2018
Messages
4,600
Likes
3,067
Location
Zg, Cro
What about the "generate minimal phase" option in REW?
I thought it would correct the phase difference caused by the measuring distance?

It wouldn't. It would calculate minimum and excess phase graphs so you can compare them with your phase response.
Maybe you confused it with "Estimate IR delay"? :)
 

Hayabusa

Addicted to Fun and Learning
Joined
Oct 12, 2019
Messages
834
Likes
575
Location
Abu Dhabi
It wouldn't. It would calculate minimum and excess phase graphs so you can compare them with your phase response.
Maybe you confused it with "Estimate IR delay"? :)

Then I get this:
(comparing minimum phase with Estimate IR delay)
1579682677487.png
 
OP
Krunok

Krunok

Major Contributor
Joined
Mar 25, 2018
Messages
4,600
Likes
3,067
Location
Zg, Cro
@Pio2001 I tried fixing the mic instead of holding it in hand and the sweep graph is equally choppy.
 
OP
Krunok

Krunok

Major Contributor
Joined
Mar 25, 2018
Messages
4,600
Likes
3,067
Location
Zg, Cro
This picture is interesting.
The large peaks at 130, 170 and maybe 240 Hz are significant.

Narrow peaks can be ignored, as they are probably measurement artifacts : when the test signal becomes very weak, at the bottom of dips in the frequency response, the phase response suddenly jumps 180° away. Since the signal is barely detectable, the software can't always read if the jump is positive or negative (+180 or -180° both lead to the same value), so it may draw a peak instead of a dip in the group delay graph, and conversely.

But the fact that the group delay is around 80 ms at 130 and 170 Hz is a bit worrying. Except if these parts are at the bottom of dips in the amplitude response curve, as it is often the case. Then it doesn't matter, since these frequencies are nearly silent.

The hills at 240, 390 and 480 Hz are strange. I have nothing like this in the raw group delay graph from my listening position :

View attachment 46818

Do you think that resolution of human hearing is such that only un-smoothed graphs provide correct picture? Personally, I'm not sure this is the case.
 

Pio2001

Senior Member
Joined
May 15, 2018
Messages
317
Likes
507
Location
Neuville-sur-Saône, France
They are bottom of dips. Btw, I based my amplitutude correction on MMM RTA pink noise which averaged those narrow dips.

They don't seem to be completely at the bottom of dips.
It would be interesting to create a special test signal for them, mixing time-aligned 2010 CEA bursts at these frequencies. If your measurement is correct, they should sound completely delayed. It should even be possible to record it with the mic from the listening position.

Here is how single sweep looks from LP:

Unsmoothed (I don't know if it is normal that it is so "choppy")
View attachment 46885

It seems normal to me.
The curve is excellent below 120 Hz. Is it equalized ?

Why do you think group delay of my room will mask anything as I corrected it at the LP? Those GD graphs are recorder at LP so they contain GD of speaker + GD of room at LP.

Yes, but only the average is corrected. While with headphones, even the raw curve is flat. This is a better reference.
But yes, once you have got a good room eq, most of these effects are audible with speakers.

Well, i can hear the difference when listening to the speakers, especially on 1st part of 1st video - that one is extremely boomy and with attenuated highs. Bass on second one sounds shallow.

Btw, electronic bass on the songs I listen doesn't sound anything like that. I tested bass response with Focal Test CD No2 and drums and bass guitar sound very natural. My older son who play guitar in the band also agrees to that and as they practice often I trust that he knows how drums and bass guitar should sound in the room.

One of the requirements for posting this video on Youtube was that it featured no copyrighted content that Youtube would automatically recognize and block.
This excerpt is from 4 Voice III (Pete Namlook), copyright Fax records. The odds that it gets removed are very low, as the label is no more active. The author and founder is dead :(

And after all, it features strong low, medium and high frequencies. The differences are easily heard.

I would very much appreciate if you can find those files and send it to me. :)

In fact I was wrong. There is some clear pre-echo even in the reconverted versions of this file :facepalm:
Anyway, here they are.

Namlook_Flat Converted minimal phase Corrected Minimal.wav
Namlook_Flat Converted minimal phase Corrected Linear.wav
 

Pio2001

Senior Member
Joined
May 15, 2018
Messages
317
Likes
507
Location
Neuville-sur-Saône, France
Do you think that resolution of human hearing is such that only un-smoothed graphs provide correct picture? Personally, I'm not sure this is the case.

I don't know.
I think that this is not very different from the audibility of the amplitude peaks. Below 100 Hz, we can hear the difference between a narrow, high peak, and a shallow, wide one. That's why I don't smooth this part. In fact, for amplitude curves, I find the Var smoothing perfect. That is also the same kind of natural smoothing that we get if we make a moving microphone measurement around the position of one seat.

But with group delay graphs, there is a completely different problem. Since the graph is nothing more than the slope of the phase graph, applying smoothing does not display the average group delay. Instead it displays the slope of the smoothed phase graph (John, please correct me if I am again wrong !). Which is just an arbitrary lowered version of the original.

If you correct an average version of the phase, the sharp local variations will remain. Which means that it will have a very weak effect on the real group delay. If you ask for the smoothed version of the group delay, you will see a nice graph, but if you measure the raw group delay after correction, I think that it won't look very different before and after correction.
 
OP
Krunok

Krunok

Major Contributor
Joined
Mar 25, 2018
Messages
4,600
Likes
3,067
Location
Zg, Cro
I don't know.
I think that this is not very different from the audibility of the amplitude peaks. Below 100 Hz, we can hear the difference between a narrow, high peak, and a shallow, wide one. That's why I don't smooth this part. In fact, for amplitude curves, I find the Var smoothing perfect. That is also the same kind of natural smoothing that we get if we make a moving microphone measurement around the position of one seat.

It is explained in Toole's book - dips are far less problematic then peaks and audibility of the peaks depends on their Q - the lower the Q the more we hear it. This was posted recently somewhere on the forum.

But with group delay graphs, there is a completely different problem. Since the graph is nothing more than the slope of the phase graph, applying smoothing does not display the average group delay. Instead it displays the slope of the smoothed phase graph (John, please correct me if I am again wrong !). Which is just an arbitrary lowered version of the original.

You are wrong. GD (derivation of phase per frequency) is calculated with full precision and then smoothing is applied. For that reason you can always remove smoothing and check how the unsmoothed version looks.
 
OP
Krunok

Krunok

Major Contributor
Joined
Mar 25, 2018
Messages
4,600
Likes
3,067
Location
Zg, Cro
It seems normal to me.
The curve is excellent below 120 Hz. Is it equalized ?

It is.

Btw, IIRC Toole suggests presenting FR at 1/20 precision (smoothing).

Here is how FR of both channels look with 1/24 precision, 70-80 RTA samples for each channel:

Capture.JPG


Yes, but only the average is corrected. While with headphones, even the raw curve is flat. This is a better reference.
But yes, once you have got a good room eq, most of these effects are audible with speakers.

You always correct spatially averaged signal - this is valid for both, amplitude and phase.
Headphones doesn't have reflections and they laways sit precisely on your ears so they can hardly be compared with speakers from that perspective.

Your Youtube examples were very much audible with my speakers.


Thank you!
 

dasdoing

Major Contributor
Joined
May 20, 2020
Messages
4,301
Likes
2,769
Location
Salvador-Bahia-Brasil
Might be a stupid question, but why correct phase of the speaker only and not the phase at the listening position?

I created a virtual speakers for headphones and only got good sounding results once I minimum phased the whole spatial audio impulse responses:
 
D

Deleted member 4708

Guest
Question on measuring using REW: When I measure my headphones, at times there is echo present at high frequencies. Almost as is the sweep repeats itself at lower volume (again - at higher frequencies only). Sometimes I get this sometime I do not. Any guesses as to why?
I changed the position of the headphones, I even took them off the ear (miniDSP) measurement gig - nothing.
Some days this doesn't happen at all.
 
D

Deleted member 4708

Guest
It sounds like alisaing. A kind of distorsion that occurs when a digital stream is poorly resampled (for example from 48000 Hz to 44100 Hz).
Thank you! You were right!
Another question:
All my headphones show a peak in distortion around 4 kHz. Looking at my headphones when measured by pros there is no such bump.
For example, at 90 db the Stax SR-009 is approx 0.1% THD - however the bump is 0.6% THD (4 kHz).
All the other headphones have around 0.5% THD (even more) increase around 4 kHz. (Senny HD650, Focal Elex).
I use https://www.minidsp.com/products/acoustic-measurement/ears-headphone-jig for the headphones measurement and REW.
Any ideas?
 

Jdunk54nl

Addicted to Fun and Learning
Joined
Aug 5, 2020
Messages
969
Likes
1,049
Location
Arizona
If anyone wants to measure phase in real time, check out open sound meter. It is a dual channel fft program (similar to smaart and others) and ITS FREE!

https://opensoundmeter.com/

I posted a thread on it and you can even semi accomplish using it with a usb microphone and usb external sound card loopback (I haven’t had success with an internal loopback and usb mic)

https://www.audiosciencereview.com/...ence-and-some-more-measurement-program.20062/


If you have an xlr mic and interface then you can truly use it.
 
D

Deleted member 4708

Guest
I am using my Senny HD 650 trying to eq them. I used 2 headphone amps: Chord Mojo and Motu 8A.
First time I am taking measurements with no eq, trying to establish a base. However, the 2 amps yield vastly different measurements.

Mojo looks good, as expected from an HD 650. No huge deeps.
Motu looks bad - it has 50db deeps (!!!). The headphone position is the same - no change on the mini DSP EAR. I tried various levels with both DAC/amps. The difference is the same.
Any ideas? Is there a problem with the MOTU 8a headphone amp?
 

Attachments

  • good.jpg
    good.jpg
    221.7 KB · Views: 129
  • motu2.jpg
    motu2.jpg
    229.9 KB · Views: 99
Last edited by a moderator:
D

Deleted member 4708

Guest
Uh oh. As soon as I posted I tried one last thing - changed the routing for the headphone. Now the 2 measurements look the same. I am puzzled.
Routing mains to the headphone - poor measurements.
Routing "From computer 1 and 2" to the headphones - good measurements.
 
Last edited by a moderator:
Top Bottom