• WANTED: Happy members who like to discuss audio and other topics related to our interest. Desire to learn and share knowledge of science required. There are many reviews of audio hardware and expert members to help answer your questions. Click here to have your audio equipment measured for free!

Strange SBIR issue, because the frequency doesn't match anything

neRok

Senior Member
Joined
Oct 7, 2022
Messages
304
Likes
175
Location
Australia
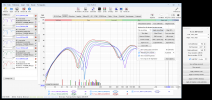
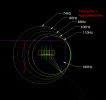
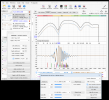
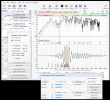
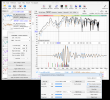
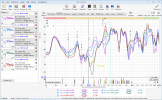
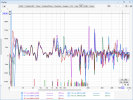
The other day I was testing the response of one of my speakers at different distances from the side wall. I've been looking at the results in different ways and thought to use FDW (frequency dependent window). The 2 and 3 cycle windows showed 2 specific nulls that steadily lowered in frequency as the distance from the closest wall increased, which makes sense (longer distance to wall = lower frequency). The thing is, when I drew up the speaker positions and frequencies in CAD, that distance (1/4 cycle of null centre) doesn't match the "wall" (or the wall with window recess in my case). But it does seem to be pretty consistent at some place beyond the window.
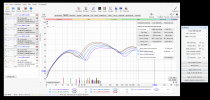
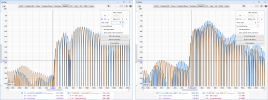
SBIR + FDW (2 cycles).png SBIR + FDW (3 cycles).png SBIR plan.png SBIR IRs.png

I checked SBIR Calc, and the test closest to the wall is 400mm from the wall, or 540mm from the window. 540 gives first null at 159Hz on the calc, and manually doing the calculation it's 343/0.54/4=159Hz. But the problem frequency for the 400 test is quite obviously not 159Hz, but ~110Hz, which is 780mm 1/4 cycle length. Also the second null is at ~550Hz, which is the "5/4 cycle" of the same reflection, so 343/550/4*5=780mm.

So the problem seems to be consistent, but it just doesn't align with the wall. I checked with the tape measure, but it doesn't match any corners (wall to wall, wall to ceiling, etc) or edges (wall to window recess). Any ideas what is going on?

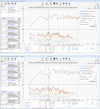
Here's a few more graphs showing the problem. The distortion peak at 90Hz seems pretty common, I'm not sure if it could be relevant?
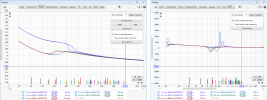
SBIR phase+GD.png BDIR distortion.png
 

ozzy9832001

Senior Member
Joined
Feb 19, 2023
Messages
405
Likes
257
Any chance it's actually bouncing off another surface and then the sidewall? If you change the speakers height how differently does it behave?
 
OP
N

neRok

Senior Member
Joined
Oct 7, 2022
Messages
304
Likes
175
Location
Australia
Any chance it's actually bouncing off another surface and then the sidewall? If you change the speakers height how differently does it behave?
That's why I drew the circles in 2D and used tape measure in real life - to see what else was in the necessary distance. I thought at first it might have been the corner I was drawing the lines towards, possibly acting like a baffle edge, but it doesn't seem to line up properly.

The thing with some multi-surface reflection (as I understand it) is that the surfaces haven't moved, only the speaker. Some distance needs to have increased for the freq to drop, and the only one I can see is the relationship to the right wall.

I can't change the height easily.

-----------------

But I did do some other tests the other day that I only just thought to review the same way. In one test I grabbed the cushion bases off my couch and stuffed them in the window recess, to see what would happen. With the speaker in the same position (600 off wall), it did help absorb some peaks and did change this SBIR freq a bit, but nothing too drastic.
SBIR with cushions.png

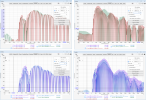
When I use the Impulse alignment to compare them (with FDW active), it does look like the absorption helped, slightly in the pre-waves, and majorly in the post-waves.
SBIR with cushions 2.png

But the FDW makes those impulses look better than they are. When I turn it off and compare some different frequencies, it looks like this;
SBIR with cushions 3.png SBIR with cushions 4.png

It seems there is pre-ringing, and with the absorption it is worse, presumably because the area of absorbed pre-ring waves are no longer cancelling all the other pre-ring wave reflections. I need to sweep my speakers close up and see if they are pre-ringing and or have this much GD.

BTW, I'm pretty sure all these sweeps were done with no EQ or DSP applied (no high pass either), except for maybe a 90Hz allpass on the left speaker, but I'm testing the right speaker here, so I presume that doesn't affect it. All the switches on my Kali IN8 were "off".

Actually, now I recall why I ended up reading some step response threads, and it's because bennybbbx was talking about Kali speakers group delay, and those threads are what came up for me on google.

Edit: Here is one more lot of screenshots, because the IR screenshots above are evidently normalised, so it can make relative levels of IR look different than they actually here. So here are the normally filtered IR's, but they also seem to look different to the above because I presume the bandwidths are different. But still in both of the following screenshots it can be seen that with absorption on the right wall, pre-ringing is louder, obviously so on the 80Hz filter.
SBIR with cushions 5.png
 
Last edited:

Curvature

Major Contributor
Joined
May 20, 2022
Messages
1,116
Likes
1,412
It's too low in frequency to be SBIR. It's probably a room mode.
 
OP
N

neRok

Senior Member
Joined
Oct 7, 2022
Messages
304
Likes
175
Location
Australia
It's too low in frequency to be SBIR. It's probably a room mode.
The modal frequencies are in the screenshots (from the Room Sim, room=4.13*3.02m). There is a length mode at 83Hz, but I wouldn't think that moving away from a side wall would affect it? The side wall modes are 57Hz and 114Hz (or if I make it wall to window they are 54Hz and 108Hz).

I don't think it matters anyway (if it's technically SBIR or a mode), because the way it seems is that they are both reflections that couple with and cancel the present output. The visualisation thread shows as much (see "Monopole located at the first null from the left wall"), and the distance for a "SBIR" and "1st room mode node" is the same = 1/4 cycle from the wall.
 

sam_adams

Major Contributor
Joined
Dec 24, 2019
Messages
1,004
Likes
2,449
. . . pre-ringing is louder . . .

Everything displayed to the left of the t=0 point is the non-linear response (distortion) of the system (which includes the room response) and background noise.
 

Curvature

Major Contributor
Joined
May 20, 2022
Messages
1,116
Likes
1,412
The modal frequencies are in the screenshots (from the Room Sim, room=4.13*3.02m). There is a length mode at 83Hz, but I wouldn't think that moving away from a side wall would affect it? The side wall modes are 57Hz and 114Hz (or if I make it wall to window they are 54Hz and 108Hz).

I don't think it matters anyway (if it's technically SBIR or a mode), because the way it seems is that they are both reflections that couple with and cancel the present output. The visualisation thread shows as much (see "Monopole located at the first null from the left wall"), and the distance for a "SBIR" and "1st room mode node" is the same = 1/4 cycle from the wall.
Basics:
  • All objects reflect, pass or absorb sound. How much of each depends on the wavelength and the objects.
  • This means visible boundaries aren't the same as acoustic boundaries.
  • Walls, ceilings and floors flex and introduce phase shift.
  • Modes depend on room dimensions and are relevant where wavelengths exceed room dimensions: bass usually below 100Hz. When you move your listening position you are hearing different modal peaks or troughs. When you move your speakers, you are exciting different modes in a modal map. The boundaries are coupled to the modes. There are no discrete reflections.
  • Higher in frequency, usually 100-500Hz, SBIR occurs due to interference between speakers and room boundaries due to discrete reflections. When you move your speakers, you are changing path lengths to your ears from walls, desk, etc.
To me all of the above means you will never know everything about your room. Just most of the important things and what to do about them.
bennybbbx
This user has no technical education and posts nonsense, and refuses help.

FDW, which shows mostly direct sound, is not relevant for your hearing below ~1.5kHz. You can use it for investigation but not EQ at MF or LF.

The modes in the simulation below seem to match what you've measured.

1693970510242.png
 
OP
N

neRok

Senior Member
Joined
Oct 7, 2022
Messages
304
Likes
175
Location
Australia
FDW, which shows mostly direct sound, is not relevant for your hearing below ~1.5kHz. You can use it for investigation but not EQ at MF or LF.
2 cycles of 100Hz is 20ms which is ~6.9m travel, so there's a ton of reflections baked in. At 1.5kHz 2 cycles is only 0.45m distance, so barely any time for reflections. I am wondering about FDW in this case though, because if there is increased GD at these frequencies (which there is) then it makes sense for the first cycles of FDW to be low (presuming FDW is pegged to T=0 and not peak energy time).

It's also strange that 2 cycle has more amplitude than 3 cycle, even though more waves have arrived. I'm still scratching my head about what amplitude means in a situation like this, because evidently more sound != more amplitude.

The modes in the simulation below seem to match what you've measured.

hunecke.de | Room Eigenmodes Calculator
The thing about that 91Hz mode is that it is Y and Z based. The relationship to Z didn't change in my tests (speaker height stayed the same), and moving towards the center of the room did change the Y, but that should just increase the affect of the mode on 91Hz (the response should get progressively worse towards the center). But in the FDW results, 91Hz does not act that way.

Below is more plots. I probably should have payed more attention to the GD plot without FDW, because it's interesting that the GD spike at ~81Hz gets a fair bit better moving away from the wall, whereas ~74Hz gets a little bit worse. And on the "whole" SPL screen its interesting to see that the "order" of best to worst matches "closest to furthest", the most notable deviation being where I marked "strange". Also interesting to note that the order at Y1,Z1 mode = 91Hz is not the same at the following Y2,Z1 mode = 134Hz. Also interesting to notice that the major peaks at ~124Hz aren't the length mode at ~125Hz, because it wouldn't make sense for it to change that way. It must be one or both of the modes on your linked calculator at 121.7Hz and 124Hz.
SBIR spl.png SBIR GD.png
 

audiofooled

Addicted to Fun and Learning
Joined
Apr 1, 2021
Messages
533
Likes
594
Take a look at this https://amcoustics.com/tools/amroc?l=413&w=302&h=240&r60=0.6

It seems that your room's distribution of modes is a bit challenging (Bonello - modes per third). I'd try to position the speakers and MLP out of the red/blue pressure zone areas as much as possible, so not too close to any of the boundaries.

Good rule of thumb would be to position each of the speakers central axis at 25% of the length of the longer wall with leaving 50% of the length in between them. Then play with small increments of moving them away from the front wall, also a bit of toe in.

A very good article about early reflections and room modes: http://www.tonmeister.ca/wordpress/2014/02/14/bo-tech-but-what-if-my-room-is-scandinavian/
 

dasdoing

Major Contributor
Joined
May 20, 2020
Messages
4,301
Likes
2,774
Location
Salvador-Bahia-Brasil
Good rule of thumb would be to position each of the speakers central axis at 25% of the length of the longer wall with leaving 50% of the length in between them.

someone actually calculated that 38% is that best theoraticle startingpoint, read on the leftside here: https://realtraps.com/art_room-setup.htm


The following is from a newsgroup post where Wes explained his logic behind the 38 percent rule.

As my article on bass waves illustrates, every bass frequency has a corresponding place or places in the room where there is a null due to destructive interference. The most deadly places to listen are those where the natural modal frequencies of the room are being cancelled, because then you are hearing something completely different from what others in the room are hearing.

For instance, a 14 foot long room would have a large boost generally at 40 Hz due to modes, but at 7 feet from the front wall there would be a serious null at that frequency due to destructive interference. If the listening position were placed at this half-way point, you'd hear very little at 40 Hz while those at the back of the room would hear a boost because 40 Hz is a modal frequency.

Similarly, the second harmonic of 40 Hz (80 Hz) will exhibit a null at the point one quarter of the distance from the back wall. If you listen at this point the same problem is present, where the bass you hear is radically different from that heard at other points in the room.

If you draw a graph carrying this out to the first 5 or 6 harmonics, you'll notice that the point in the room that is least affected is 38 percent from the front of the room. Coincidentally, this is also the Golden Mean point.
 

ozzy9832001

Senior Member
Joined
Feb 19, 2023
Messages
405
Likes
257
In your graphic with the pillows in the window cavity...that doesn't surprise me to see changes in the 300hz-400hz region. Normal window glass typically resonates somewhere in that range. Mine are about 325hz.
 
Top Bottom