Not sure I would use PMC as an example of ‘ruler flat’.
Keith
Show me something as flat as this, please.

Not sure I would use PMC as an example of ‘ruler flat’.
Keith
If you look at the scale, this is pretty much within +/- 3dB. It might also be worth referring back to Toole’s research, which shows that a narrow Q peak or dip has to be approximately 10 dB above the average level before it becomes objectionable. From the book:
")
This time window provides a resolution of 200 Hz, if it is a fixed single-period window, rather than frequency dependent.Measuring a tall, multi-way system configured for farfield listening is tricky, not least because our default test distance is 1m with a time window sufficient to exclude all reflections within 4-5msec of the incident wavefront. Thus the ~6dB notch in the Alexx V's forward response at 2.7kHz [see Graph 1, below] is indicative only of very nearfield listening, this midrange suckout progressively filling in with distance, tightening the ±3.3dB response error to a superior ±2.5dB.
So basically the measurements (and especially the corresponding charts/graphs) are rather useless if they cannot be compared (without additional work).If you look at the scale, this is pretty much within +/- 3dB. It might also be worth referring back to Toole’s research, which shows that a narrow Q peak or dip has to be approximately 10 dB above the average level before it becomes objectionable. From the book:
View attachment 186779
If you then check their measurement conditions, this isn’t a comparable data set to something like the NFS.
From your own link
This time window provides a resolution of 200 Hz, if it is a fixed single-period window, rather than frequency dependent.
They also don’t list what their reference axis was. I’m going to assume it’s on-axis with the tweeter, and not the mid-range dome. It would be nice to see the CSD or wavelet analysis, since that would indicate whether the notch is caused by diffraction or resonance, but that would also require a measurement taken in the acoustic far-field for all of the sources on the baffle.
Not all measurements are the same! This also highlights the importance of documenting the test setup alongside any plots.
Not strictly true. If you know what the conditions of measurement were, and have other things like the speaker cabinet and transducer dimensions then comparisons can be made. But likewise, you have to be careful talking in absolutes - and certainly be wary of dismissing an entire brand or line of speakers because of a graph presented without context.So basically the measurements (and especially the corresponding charts/graphs) are rather useless if they cannot be compared (without additional work).
That is my point. As a consumer I don't have all these additional information on hand. And in this thread you can watch the behavior you be warning of: dismissing an entire brand only by showing frequency response graphs from a lot of different sources.Not strictly true. If you know what the conditions of measurement were, and have other things like the speaker cabinet and transducer dimensions then comparisons can be made. But likewise, you have to be careful talking in absolutes - and certainly be wary of dismissing an entire brand or line of speakers because of a graph presented without context.
Nothing to add!The same concepts apply to almost any kind of dataset, in any field. Very few things are perfectly equivalent, and there are always some conditions to be mindful of. This is why statistical analysis of results and confidence metrics are a key part of proper research.
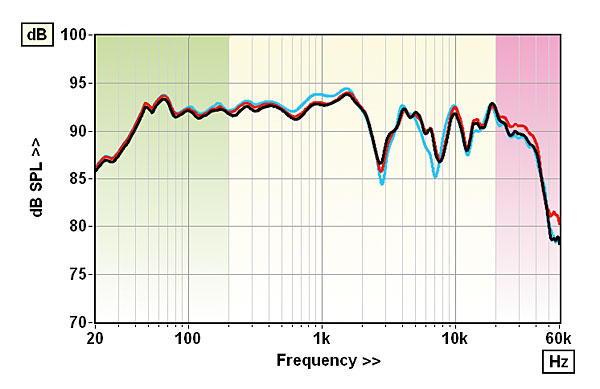
Google Translate does a good job of their reviews and analysis. Here’s the opening summary:802D4 measured on Audio.PL. I think yellow is 30° horizontal and shows some 8dB discontinuity between mid and tweeter.
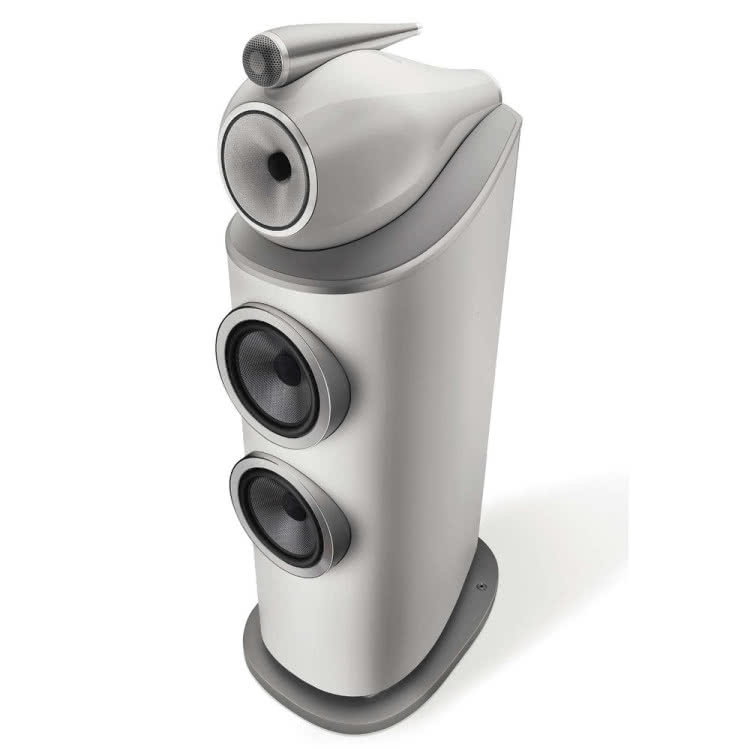
BOWERS & WILKINS 802 D4
Było, jest i będzie wiele firm głośnikowych, high-endowych odlotów i przylotów, katastrof, ekscytacji i spekulacji. Co miesiąc moglibyśmy ...audio.com.pl
View attachment 187002
Lab
Balanced characteristic, with a smooth transition through the second crossover frequency and good dispersion (apart from the largest 30O angle) - the best we have seen from a Bowers in many years. Beautifully stretched low frequencies (-6 dB at 27 Hz). High sensitivity 90 dB, nominal impedance 4 Ω (3 ohm minimum).
Sound
Juicy, clear, consistent and expressive. Lively midrange, shiny highs. Perfect bass - solid, stretched, dynamic, varied, without prominence - suitable not only for large rooms. Rich and effective, but also natural and easy to pick up.
Why is the measured response, shown above, so poor? Looking at those curves, one of which is the on-axis response, there appears to be a significant balance problem across the frequency range. Is the coloration that results from this a desirable design "feature". Compared to the response of a B&W DM6 (below), the B&W 802 D4 seems to behave much worse. Would we not expect something similar to the DM6 from a modern B&W design?802D4 measured on Audio.PL. I think yellow is 30° horizontal and shows some 8dB discontinuity between mid and tweeter.
View attachment 187002
Also entertaining to see the current entry Canton floorstanding model measured at the same time from the same magazine, 900€ vs 28000€ pair price, 900€ Canton802D4 measured on Audio.PL. I think yellow is 30° horizontal and shows some 8dB discontinuity between mid and tweeter.
BOWERS & WILKINS 802 D4
Było, jest i będzie wiele firm głośnikowych, high-endowych odlotów i przylotów, katastrof, ekscytacji i spekulacji. Co miesiąc moglibyśmy ...
View attachment 187002


The divisions on this plot are 2 dB, as the y-axis is the 50 dB one. On the Polish site plot, they’re 2.5 dB, but the height of the chart is much larger. Eyeballing it, they're not so different if one is shrunk or the other stretched to match.Why is the measured response, shown above, so poor? Looking at those curves, one of which is the on-axis response, there appears to be a significant balance problem across the frequency range. Is the coloration that results from this a desirable design "feature". Compared to the response of a B&W DM6 (below), the B&W 802 D4 seems to behave much worse. Would we not expect something similar to the DM6 from a modern B&W design?
View attachment 187078
Post pictures please, nice audio systemJust wanted to say I love my 802d4 with jc1+ monoblocks. C49 preamp
wish you enjoy them a lotThey are setup temporarily at my job to break in. Amps are conditioned by Niagara 5000, power cables are blizzards from amp to 5000 and tornado HC from 5000 to wall outlet. Speaker cables are thunderbird and Thunderbird bass. Xlr cables from preamp to amps.View attachment 225693View attachment 225681
to me is one of the best looking speaker ever madeThank you! I love the new shape as well! If money was no object or I got lotto these are next!wish you enjoy them a lot
Personally i would pick your speaker any day at the week xDThank you! I love the new shape as well! If money was no object or I got lotto these are next!View attachment 225699
Thanks! What system do you have?Personally i would pick your speaker any day at the week xD