
Referring to https://www.audiosciencereview.com/...to-reinvent-home-music.1700/page-5#post-65105
There are three files:

Known test conditions:
The microphone was a UMM-6, with a calibration file named narrow_band_response_0_degree.frd
I'll assume the absolute SPL levels shown are reasonable (in the first file).
These traces were taken at 1m and the only difference between them was the level of the sweep tone, and the HomePod did what it does on its own.
I don't know the relationship of the speaker to the walls around it
---
Update:
Ok, so, the traces show Homepod's Volume Control action, and not necessarily its response to differing input levels.
---
I don't have a Homepod, or any other modern Apple stuff, though I do have an antique Mac in the garage someplace. Anyone need a 200meg hard disk?
---
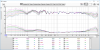
The Homepod Sweep file contains 10 sweeps, named 10% to 100%:

This is a set of sweeps with increasing volume, stepped about 3dB (except the lowest). These sweeps were used to create the data in the other two files below.
---
The Homepad Normalized file contains 10 sweeps, named 10% to 100%:

These are the same set of measurements, but the "level" is adjusted on the display so they all overlap at about 1kHz. Relative levels are maintained, absolute levels are meaningless. (example: the softest sweep shows over 110dB in the bass, but the actual was 70dB)
This shows the range of difference in the bass and treble at different playback SPL. In this case, the loudest trace is the lowest line (most attenuation of the extremes).
---
The Homepod Loudness Compensation file contains the 10 Normalized sweeps, and does another manipulation of the data, to compare the 10% through 90% files to the baseline, the 100% measurement (shown as the 0dB flatline).

This shows bass and treble boost (or maybe just lack of attenuation) at lower SPL. The lowest SPL trace is at the top, louder as you go down (on the bottom display)
(more to come)
There are three files:
Known test conditions:
The microphone was a UMM-6, with a calibration file named narrow_band_response_0_degree.frd
I'll assume the absolute SPL levels shown are reasonable (in the first file).
These traces were taken at 1m and the only difference between them was the level of the sweep tone, and the HomePod did what it does on its own.
I don't know the relationship of the speaker to the walls around it
---
Update:
HomePod placement was in a corner, 2 feet from rear/side wall and tweeter level about 38" off the ground, mic was 1 meter from the HomePod out in the room with a 30º angle in line to listening position. The audio was directly streamed from REW on a Mac with REW's sweep level held constant. I have GIK triangle corner traps, 6" bass traps on first reflection points with a BAD diffuser panel and 1D styrofoam diffusers directly to left/right of LP. Despite the diffusers, I've been told the room is exceedingly dead which gives me warm and fuzzies.
If streaming from iTunes, the volume slider in the software directly controls HomePod's volume level. For instance, if you are playing a track and ask Siri "Hey Siri, what's the volume?" Siri will respond with "the volume level is 20%." If you adjust the slider in iTunes to the right and ask Siri again, she will respond with "the volume level is 40%." In these measurements, I asked Siri to change the volume level to 10%, 20%....100% but REW's level was not adjusted.
Ok, so, the traces show Homepod's Volume Control action, and not necessarily its response to differing input levels.
---
I don't have a Homepod, or any other modern Apple stuff, though I do have an antique Mac in the garage someplace. Anyone need a 200meg hard disk?
---
The Homepod Sweep file contains 10 sweeps, named 10% to 100%:
This is a set of sweeps with increasing volume, stepped about 3dB (except the lowest). These sweeps were used to create the data in the other two files below.
---
The Homepad Normalized file contains 10 sweeps, named 10% to 100%:
These are the same set of measurements, but the "level" is adjusted on the display so they all overlap at about 1kHz. Relative levels are maintained, absolute levels are meaningless. (example: the softest sweep shows over 110dB in the bass, but the actual was 70dB)
This shows the range of difference in the bass and treble at different playback SPL. In this case, the loudest trace is the lowest line (most attenuation of the extremes).
---
The Homepod Loudness Compensation file contains the 10 Normalized sweeps, and does another manipulation of the data, to compare the 10% through 90% files to the baseline, the 100% measurement (shown as the 0dB flatline).
This shows bass and treble boost (or maybe just lack of attenuation) at lower SPL. The lowest SPL trace is at the top, louder as you go down (on the bottom display)
(more to come)
Attachments
Last edited: