• WANTED: Happy members who like to discuss audio and other topics related to our interest. Desire to learn and share knowledge of science required. There are many reviews of audio hardware and expert members to help answer your questions. Click here to have your audio equipment measured for free!

Audibility of group delay at low frequencies

andreasmaaan

Master Contributor
Forum Donor
Joined
Jun 19, 2018
Messages
6,652
Likes
9,408
In the spectrogram tab
View attachment 98334

You can change the appearance settings as well -- just change it to whatever method or resolution is needed to see things clearer.

FDW doesn't affect the spectrogram at all, but it can clear up some of the reflection-induced rotations in seen in the phase traces.

From REW's help doc:

Fourier or Wavelet.

In Fourier mode the plot uses fixed width windows, which mean the plot has the same time resolution at all frequencies. If the plot spans a wide range of frequencies this usually means the time resolution is either too low at high frequencies or too high at low frequencies. A 100 ms window, for example, gives 10 Hz frequency resolution. At low frequencies that is a big octave fraction (1/1.4 octaves at 20 Hz), at high frequencies a very, very small octave fraction (1/1386 octaves at 20 kHz).

For a time-frequency plot it would be more useful if the tradeoff between time and frequency resolution varied with frequency, using a constant octave fraction for frequency resolution rather than a constant number of Hz and so giving higher time resolution at high frequencies and lower at low frequencies. A wavelet transform can achieve that, specifically a constant Q Continuous Wavelet Transform (CWT). A constant Q wavelet transform is mathematically equivalent to using a frequency-dependent window to produce the spectrogram, which is what REW does.


---

The wavelet view is a favorite of mine. You can see reflections and resonances found in the impulse and ETC, and the broken solid track lines also seem to correlate well with the actual phase itself (best when zoomed-in really close).

Ok, thank-you! This is not the first time I've given bad advice due to incompetently trying to view something in REW. I'll edit my post to remove the misleading info :)
 

ernestcarl

Major Contributor
Joined
Sep 4, 2019
Messages
3,113
Likes
2,330
Location
Canada
Ok, thank-you! This is not the first time I've given bad advice due to incompetently trying to view something in REW. I'll edit my post to remove the misleading info :)

No prob. There's a whole bunch I don't know about REW myself. But it's no wonder why professional acousticians love & endorse it even though they use software that's probably more advanced in some features like Smaart.
 

dasdoing

Major Contributor
Joined
May 20, 2020
Messages
4,301
Likes
2,773
Location
Salvador-Bahia-Brasil
ok, guys,

some clarifications.

forget the group delay in the mdat I posted, as that was not the point.
why is the group delay close? because I manualy (tryed to) corrected it with a delay before. It turned out that Align2/DRC (filter generator) ended up actualy overcompensating the group delay (I guess because my delay ended up creating that delay peak at 120Hzish). As I mentioned I will correct my system again and will let Align2/DRC do all the delay correction.

the point here was the effect the FIR filters have on the center clarity. I mentioned this, and then was asked by @andreasmaaan if this is an effect of phase correction or magnitude correction. So I took the MP version of my current correction to compare. I then posted the MDAT mainly to show that the FRs diferences between MP version and LP version shouldn't make a diference in sound. they do sound VERY diferent though. why???


because there IS a big diference here in the phase. the phase of the MP version is steady falling, the phase of the LP version is close to horizontal.
what about the vertical jumps? imo REW should have an option to filter those jumps out (for in-room meassurements), since they seam to be caused by dips, not by real phase shifts. the phase view was developed for loudspeaker meassurement where those jumps wont occure.

since you guys got curious about the group delay thing: I will meassure and correct again my system, this time without my manual delay so FIR will do all the group delay correction, and then post another mdat
 

andreasmaaan

Master Contributor
Forum Donor
Joined
Jun 19, 2018
Messages
6,652
Likes
9,408
the point here was the effect the FIR filters have on the center clarity. I mentioned this, and then was asked by @andreasmaaan if this is an effect of phase correction or magnitude correction. So I took the MP version of my current correction to compare. I then posted the MDAT mainly to show that the FRs diferences between MP version and LP version shouldn't make a diference in sound. they do sound VERY diferent though. why???

Thanks for all the work you're going to @dasdoing. I have to be honest with you though, I'm still finding it incredibly hard to believe that the very benign degree of group delay you have corrected in the midrange has led to a large audible improvement.

I would again suggest that you see if you can pick a difference using an ABX comparator between those two files I produced from your short music sample, because the phase distorted version of that file contained more phase shift than your loudspeakers produce, and neither I nor any of the other half dozen or so people who have listened have been able to discern any difference between the files. And as I've mentioned before, no published study of which I'm aware has found that the degree of phase shift your uncorrected system is generating should be audible with loudspeakers and music.
 

dasdoing

Major Contributor
Joined
May 20, 2020
Messages
4,301
Likes
2,773
Location
Salvador-Bahia-Brasil
Thanks for all the work you're going to @dasdoing. I have to be honest with you though, I'm still finding it incredibly hard to believe that the very benign degree of group delay you have corrected in the midrange has led to a large audible improvement.

I will try to produce those convolved tracks, so you guys can hear the diference. again, the diference is not in the goup delay though, but the overall shape of the phase

I would again suggest that you see if you can pick a difference using an ABX comparator between those two files I produced from your short music sample, because the phase distorted version of that file contained more phase shift than your loudspeakers produce, and neither I nor any of the other half dozen or so people who have listened have been able to discern any difference between the files.

that topic is open in a tab since you mentioned it ;-)
I will come back to that, since this is all related
 

ernestcarl

Major Contributor
Joined
Sep 4, 2019
Messages
3,113
Likes
2,330
Location
Canada
... because there IS a big diference here in the phase. the phase of the MP version is steady falling, the phase of the LP version is close to horizontal.

Well, I already said that there looks to be an improvement in the measurements. What I'm skeptical about is the "big-ness" of this change in any practical sense.

Yeah, sure, I'll listen to your tracks.
 

dasdoing

Major Contributor
Joined
May 20, 2020
Messages
4,301
Likes
2,773
Location
Salvador-Bahia-Brasil
What I'm skeptical about is the "big-ness" of this change in any practical sense.

I do fully understand this. I will make it audible to you guys this week. I guess correcting (MP and LP version) binaural IRs of another room will do the job to show this on headphones
 

BenB

Active Member
Joined
Apr 18, 2020
Messages
284
Likes
446
Location
Virginia
Frequency response is the same, it is only delay that changes across the frequency range, and to make that happen, there has to be non-minimum-phase phenomena present. In the experiment, I create it on software.

In order to rule out magnitude response differences when doing ABX testing, you need to make sure that the differences measure in the hundredths or thousandths of a dB. From the plots you posted, it looks like you have at least an order of magnitude more frequency variation than you should. Admittedly, most software that generates these kinds of "effects" don't do so with ABX testing in mind, and generally a difference of a few tenths of a dB is fine for other applications.

See this post in a thread about time alignment for an example of tolerances acceptable for ABX testing:
https://www.audiosciencereview.com/...me-alignment-does-it-matter.13849/post-436924

I have posted several allpass filters that you are welcome to use for ABX testing. I am also considering making and posting all-pass-filtered and unfiltered waveforms, though whatever material I choose, I know there will be those saying it's the wrong thing.
 

bobbooo

Major Contributor
Joined
Aug 30, 2019
Messages
1,479
Likes
2,079
In order to rule out magnitude response differences when doing ABX testing, you need to make sure that the differences measure in the hundredths or thousandths of a dB. From the plots you posted, it looks like you have at least an order of magnitude more frequency variation than you should. Admittedly, most software that generates these kinds of "effects" don't do so with ABX testing in mind, and generally a difference of a few tenths of a dB is fine for other applications.

Do you have any evidence that level differences of hundredths, let alone thousandths of a decibel are in any way audible? Because I haven't seen any. The scientific consensus says a tenth of a decibel is the just noticeable difference at the very least, and that's for a 0.1 dB per octave spectral tilt (equivalent to a 1 dB slope in the audible band from 20 Hz to 20 kHz).
 

BenB

Active Member
Joined
Apr 18, 2020
Messages
284
Likes
446
Location
Virginia
Do you have any evidence that level differences of hundredths, let alone thousandths of a decibel are in any way audible? Because I haven't seen any. The scientific consensus says a tenth of a decibel is the just noticeable difference at the very least, and that's for a 0.1 dB per octave spectral tilt (equivalent to a 1 dB slope in the audible band from 20 Hz to 20 kHz).

What a weird response. I specifically said that differences in the hundredths or thousandths of a dB are imperceptible, and thus safe for ABX testing. You replied by asking if I had evidence that differences of that size are audible. No I don't. I've seen evidence that changes in the tenths of a dB can be audible, which means you want to do significantly better than that when you set up a test, or else you risk misattributing any success you might have in ABX testing.
 

bobbooo

Major Contributor
Joined
Aug 30, 2019
Messages
1,479
Likes
2,079
What a weird response. I specifically said that differences in the hundredths or thousandths of a dB are imperceptible, and thus safe for ABX testing. You replied by asking if I had evidence that differences of that size are audible. No I don't. I've seen evidence that changes in the tenths of a dB can be audible, which means you want to do significantly better than that when you set up a test, or else you risk misattributing any success you might have in ABX testing.

Why would you need to level-match significantly lower (10 or even 100 times as you suggest) than the very lowest limit of audibility of 0.1 dB difference as determined by the scientific literature? And that's the lowest limit for constant spectral tilt i.e. extremely low-Q deviations (which have been shown to be more audibe than higher-Q), so the audibility threshold for most other deviations would be even higher.
 
Last edited:

BenB

Active Member
Joined
Apr 18, 2020
Messages
284
Likes
446
Location
Virginia
I downloaded the "Walking Irrevocable" 5 second clips. I noticed that all versions were the same size. I performed a single large fft, with a 20% tukey window in order to diminish the effects of any time alignment differences, and reduce spreading. I plotted the magnitude response for the original, and for the version with 20 ms GD. They did not match as well as I had anticipated. There are frequency peaks that vary by several dB.

I then proceeded to perform the same analysis with my own all-pass (group delay of about 30 ms) filter, and obtained the expected results: very, very good matching on peaks, some differences observable on dips.
Orig_vs_GD20ms_order_magnitude_ylim.pngOrig_vs_4th_order_magnitude_ylim.png
 

Thomas_A

Major Contributor
Forum Donor
Joined
Jun 20, 2019
Messages
3,469
Likes
2,467
Location
Sweden
Bumping this thread and using a recent file discussed on ASR in another matter.

I used the original file and used two 2nd order allpass filter in Audacity (allpass2 s 100 1) and (allpass2 s 200 0.7). Both were tested in ABX against the original with the following results (the 100 Hz Q=1 was easy, the 200 Hz Q=0.7 was harder).

Skärmavbild 2023-10-03 kl. 09.37.15.png
Skärmavbild 2023-10-03 kl. 12.42.01.png


Questions: Are the files correctly made with respect to filter and is the result expected?


tmuikku

Senior Member
Joined
May 27, 2022
Messages
302
Likes
338
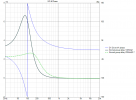
Here is group delay plots for the 100Hz Q1 and 200Hz Q0.7 all pass filters:
allpass-100Hz-Q1.pngallpass-200Hz-Q0.7.png

Both overlaid
allpass-filters.png
 

Thomas_A

Major Contributor
Forum Donor
Joined
Jun 20, 2019
Messages
3,469
Likes
2,467
Location
Sweden
Last edited:

tmuikku

Senior Member
Joined
May 27, 2022
Messages
302
Likes
338
Is this from the files? In that case it seems reasonably correct. I just wonder about the audibility then (this was headphones though). It seems to be quite low values in terms of audibility.
Hi, no it's just showing group delay of ideal all pass filters with the parameters you mentioned.
I assume filters you used to process the files are equally ideal in a way, and should impose group delay you see on the plots.

I thought to post these, as I also found the difference in samples quite audible even though the group delays don't seem too bad so though it was interesting.
 

Hayabusa

Addicted to Fun and Learning
Joined
Oct 12, 2019
Messages
837
Likes
583
Location
Abu Dhabi
This example has more than one full cycle group delay.
Other sources already confirm audibility of >1cycle group delay.
 

tmuikku

Senior Member
Joined
May 27, 2022
Messages
302
Likes
338
What do you mean? 100Hz cycle is 1/100 so 10ms, 200Hz is 5ms so group delay seems to be less than one cycle. Unless the plots are wrong or the processed audio files have more group delay than the plots indicate.
 
Last edited:
Top Bottom