-
WANTED: Happy members who like to discuss audio and other topics related to our interest. Desire to learn and share knowledge of science required. There are many reviews of audio hardware and expert members to help answer your questions. Click here to have your audio equipment measured for free!
You are using an out of date browser. It may not display this or other websites correctly.
You should upgrade or use an alternative browser.
You should upgrade or use an alternative browser.
What is your favorite house curve
- Thread starter Jerry Sobel
- Start date
Miniyouuuu
Active Member
- Joined
- Dec 9, 2022
- Messages
- 142
- Likes
- 71
Any waterfall image?
In my case, I saw that “nice” frecuency response graphs after DSP correction may create worse waterfall graphs. Specially with low bass little bumps. Those bumps could generate higher T30 or T60 times at low frecuency range.
In my case, I saw that “nice” frecuency response graphs after DSP correction may create worse waterfall graphs. Specially with low bass little bumps. Those bumps could generate higher T30 or T60 times at low frecuency range.
If anybody doubts the in room response is a moving target (circle of confusion), here is a quote of Lewis Lipnick (Stereophile Cello Palette review) dealing with Jennifer Warnes's Famous Blue Raincoat. "By gently lowering the 500Hz and 2kHz bands by 0.5dB, I can get rid of a slightly hollow upper-midrange ring. It's also possible to restore more of the harmonic color in Warnes's voice by boosting the 20kHz control by just 0.5dB."
It works often very well with harsh vocals, ie Lana del Rey's Born to die. here is what happens if you apply LL's modifications to @Floyd Toole 's ideal steady state, that might have been LL's in room response. Note that it saves the day and gets rid of harshness not by tilt, not by drastic cut of HF or boost of LF ; makes Lana very palatable by maybe recreating monitoring conditions at creation that would have been about 4 dB natural room gain below 1K, straight above 1K. Chance ? groundless conjunctions ? Works for me, I share.

It works often very well with harsh vocals, ie Lana del Rey's Born to die. here is what happens if you apply LL's modifications to @Floyd Toole 's ideal steady state, that might have been LL's in room response. Note that it saves the day and gets rid of harshness not by tilt, not by drastic cut of HF or boost of LF ; makes Lana very palatable by maybe recreating monitoring conditions at creation that would have been about 4 dB natural room gain below 1K, straight above 1K. Chance ? groundless conjunctions ? Works for me, I share.
Cincyret
Member
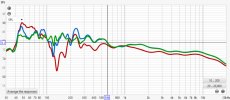
Attached is my 1st FR graph without any room EQ or Subs. After reading (many times!) this thread, I've decided to only EQ for the room (<600). I'm leaning towards a straight line -.8 dB Target, or the BK. I've downloaded all (sic) the targets on this thread.
1) Should I use a high pass filter?
2) I can't change the room, LP, or speaker location (8 ft equilateral).
Thanks,
John

1) Should I use a high pass filter?
2) I can't change the room, LP, or speaker location (8 ft equilateral).
Thanks,
John
ban25
Major Contributor
- Joined
- Nov 5, 2022
- Messages
- 1,179
- Likes
- 1,207
I think the only way to get rid of that null starting at 100 Hz is with a subwoofer or two (with flexible placement).Attached is my 1st FR graph without any room EQ or Subs. After reading (many times!) this thread, I've decided to only EQ for the room (<600). I'm leaning towards a straight line -.8 dB Target, or the BK. I've downloaded all (sic) the targets on this thread.
1) Should I use a high pass filter?
2) I can't change the room, LP, or speaker location (8 ft equilateral).
Thanks,
JohnView attachment 386511
Cincyret
Member
I agree. I used a -1 dB straight slope target. My highest filter was 550 Hz (result in Green). Now for the strange (to me) stuff. I only have a tiny sub (REL T-Zero). I set the sub filter at max (125 hz I believe) and the volume dial to 2 am. I used both High (105 Hz) AND Low (150) pass XO. The sub has a peak filter (105 hz, -2 dB, q=8). I've never seen subwoofers treated this way (???). The result is in red.I think the only way to get rid of that null starting at 100 Hz is with a subwoofer or two (with flexible placement).
Comments?
FIRST of all you should follow @OCA 's procedure to create a Virtual Bass Array that would much flatten the 131 dip and its surrounding peaks
As of now, based on the native response a Trained Listener's might be the least intrusive target for base solution
with
Generic
Number Enabled Control Type Frequency(Hz) Gain(dB) Q Bandwidth(Hz) TargetT60(ms) Shape Slope_dB/oct Frequency2(Hz) _Q2_ Slope2_dB/oct
1 True Auto PK 47.45 -7.40 4.287

2 True Auto PK 62.70 -6.90 2.600
3 True Auto PK 86.10 -3.40 4.996
4 True Auto PK 96.50 -4.70 4.996
5 True Manual PK 131.0 9.00 1.410
6 True Auto PK 192.5 -4.50 5.000
7 True Auto PK 221.0 -5.60 5.000
8 True Auto PK 301.0 -1.30 5.000
9 True Auto PK 550.0 -1.00 4.998
10 True Auto None
11 True Auto None
12 True Auto None
13 True Auto None
14 True Auto None
15 True Auto None
16 True Auto None
17 True Auto None
18 True Auto None
19 True Auto None
20 True Auto None
Compound_filters
1 True Auto None
2 True Auto None
As of now, based on the native response a Trained Listener's might be the least intrusive target for base solution
with
Generic
Number Enabled Control Type Frequency(Hz) Gain(dB) Q Bandwidth(Hz) TargetT60(ms) Shape Slope_dB/oct Frequency2(Hz) _Q2_ Slope2_dB/oct
1 True Auto PK 47.45 -7.40 4.287
2 True Auto PK 62.70 -6.90 2.600
3 True Auto PK 86.10 -3.40 4.996
4 True Auto PK 96.50 -4.70 4.996
5 True Manual PK 131.0 9.00 1.410
6 True Auto PK 192.5 -4.50 5.000
7 True Auto PK 221.0 -5.60 5.000
8 True Auto PK 301.0 -1.30 5.000
9 True Auto PK 550.0 -1.00 4.998
10 True Auto None
11 True Auto None
12 True Auto None
13 True Auto None
14 True Auto None
15 True Auto None
16 True Auto None
17 True Auto None
18 True Auto None
19 True Auto None
20 True Auto None
Compound_filters
1 True Auto None
2 True Auto None
Last edited:
Cincyret
Member
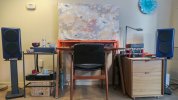
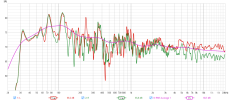
This might amuse some of you. Here's a strange room correction. I live in a studio apartment. The TV/Monitor, PC, AV Equip, and speakers are along 1 wall (see attached). I have a large (8' wide,9' tall) wood bookcase + murphy bed opposite. So I have two LP's - Bed up (music/audio books) & Bed down (TV at night). The distance to the speakers is about the same (UP or Down). The attached FR graph shows: Bed Down (red), Bed Up (blue), & Filters applied for Bed Up.
Now back to the thread topic: Here's my 'house curve':
1) I don't correct for frequencys over 600 hz (speaker)
2) I use the 'Target Settings' section to create the room curve:
a) Above 600 hz to about 20,000 hz (16,400 on graph) I measure the start and end Db level, convert Freq range to Octaves, and calculate the HF fall slope (1.8 in my case)
b) For 600 hz to 30 hz I used .8 for the LF rise slope - more for more bass
c) I manually (eyeball method) set the "Target Level (dB SPL)' for the 600-20K section to match the Target line to the Speaker FR graph
3) In the 'Filter Tasks' section I use:
a) 40 to 600 hz range
b) Indiv. & Max boost: 9 & 6
c) Flatness 3 and everything else checked
4) This resulted in five filters - I added a sixth to raise the 100 hz to 150 hz null
The two most important lessons I learned from this thread are: (1) buy a speaker with a flat FR [you don't have to correct for the speaker], and (2) just correct for the room.
I realize that room correction is very complicated what with subwoofers, modes, timing, and much else that I don't understand, but for a novice, the straight line method is easy to follow.
Thanks again for all the great comments...It's what ASR is all about!
John
Attachments
Took me like 12 hours and had to add a minidsp to my setup because ARC wasn't cutting it but finally got something I'm fairly happy with. LCR. Thoughts? View attachment 406908
Congratulations! good to know you finally got something that looks reasonably good, though you should be able to achieve this without adding a minidsp. Since you are using the mini to improve LCR, are you using two of them then, as the minidsp 2X4 HD has only 2 analog inputs but of course there are other minidsp models that has more inputs.
Anthem really has good potential but I don't think they would invest more time/funds on making it more tweakable because the vast majority of their users (you obvious know as you have visited AVSF haha) are happy with ARCG and many thought it's much better than Audyssey and Dirac Live and very few of them would bother checking measured results with REW.
With the miniDSP, you should be able to do better in the 20-60 Hz yet but of course only if you are ocd like me... Even without the mini, again, it could be done but it would a trial an error process that may last for hours just to gain 2-3 dB of smoothness in that deep bass range, imo not worth it at all, but with the mini it probably would take less than a few hours to achieve better looking curves, though again it might sound that much different audibly, for real world use.
I have never seen anyone posted better looking curves than you have now, mine look a little better in the 20-60 Hz range but not better overall, and it obviously is hard to compare and draw any conclusion as it is not apples to apples. I do feel comfortable to say for those who is keen on measurements, they might be happier to go with Audyssy and/or Dirac Live capable devices because with ARCG, pretty looking curves (say within +/2 or even 4 to 5 dB 1/12 smoothing) just don't seem possible as you and I have found out.
I don't use EQ or any correction at all. The room has a certain sound that's rather benign and unproblematic, and works well with fairly neutral speakers. My brain does the rest. Saves a lot of bothering, and money too.
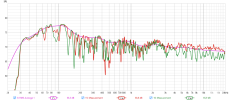
For what it's worth, the minidsp got the 20-60hz looking great using multisub optimizer. What you see here is after ARC got involved lol. But without ARC I wasn't getting proper integration. These measurements are mostly from the MLP while the MSO was done with 5 point measurement so I suppose it makes sense they're a bit different. I really appreciate the feedback!Congratulations! good to know you finally got something that looks reasonably good, though you should be able to achieve this without adding a minidsp. Since you are using the mini to improve LCR, are you using two of them then, as the minidsp 2X4 HD has only 2 analog inputs but of course there are other minidsp models that has more inputs.
Anthem really has good potential but I don't think they would invest more time/funds on making it more tweakable because the vast majority of their users (you obvious know as you have visited AVSF haha) are happy with ARCG and many thought it's much better than Audyssey and Dirac Live and very few of them would bother checking measured results with REW.
With the miniDSP, you should be able to do better in the 20-60 Hz yet but of course only if you are ocd like me... Even without the mini, again, it could be done but it would a trial an error process that may last for hours just to gain 2-3 dB of smoothness in that deep bass range, imo not worth it at all, but with the mini it probably would take less than a few hours to achieve better looking curves, though again it might sound that much different audibly, for real world use.
I have never seen anyone posted better looking curves than you have now, mine look a little better in the 20-60 Hz range but not better overall, and it obviously is hard to compare and draw any conclusion as it is not apples to apples. I do feel comfortable to say for those who is keen on measurements, they might be happier to go with Audyssy and/or Dirac Live capable devices because with ARCG, pretty looking curves (say within +/2 or even 4 to 5 dB 1/12 smoothing) just don't seem possible as you and I have found out.
Similar threads
- Replies
- 16
- Views
- 2K
- Replies
- 107
- Views
- 10K
- Replies
- 18
- Views
- 1K
- Replies
- 2
- Views
- 663
- Replies
- 22
- Views
- 2K


