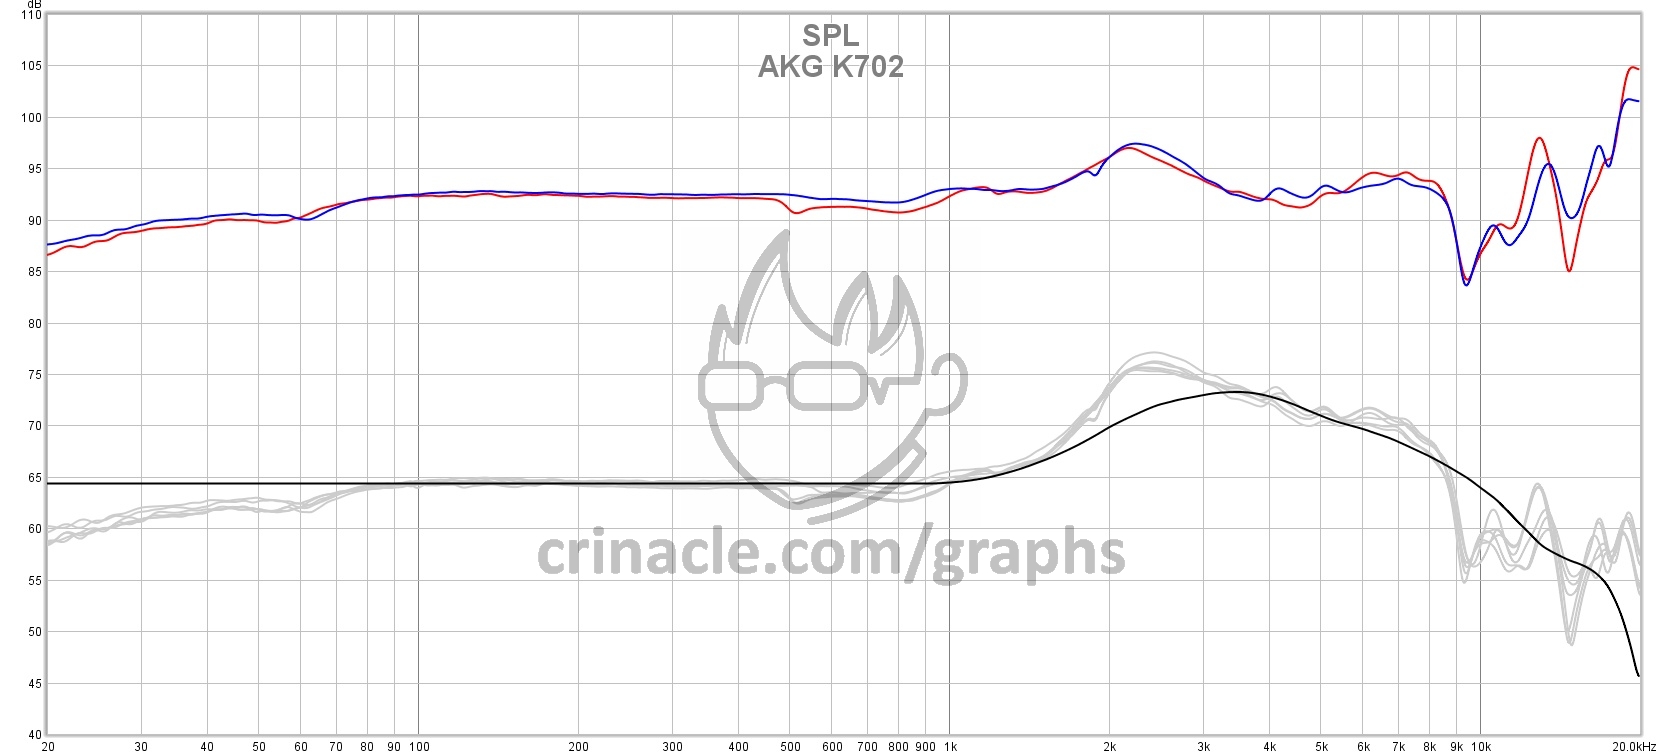
Thanks, I found his graphing tool & rejigged it to look like more like the responses I know.
View attachment 90242
Would I use VirtuixCAD to scan the picture to turn it into data, I've heard about it but never used it?
It's not far off from the EQ I'm using, but there are some differences.
EDIT: I downloaded graphs of the left & right channel in two seperate graphs without the Harman Curve pictured so I guess they'll be more easily 'scannable', I believe I'd be able to use those to "scan" to turn into numbers, but never used VirtuixCAD before.


