OK, multiple problems with this video.
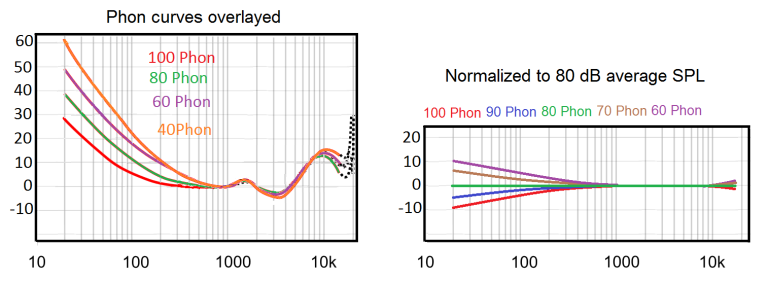
First, DEQ is volume dependent. Absolute statements about what it does without mentioning the main volume setting are rather meaningless. Here are some measurements I took years ago (please ignore the absolute SPL levels--back then I was using an outboard soundcard and obviously forgot to calibrate the absolute mic level):
View attachment 228799
As you can see, at a low volume level DEQ adds a TON of bass. At a higher level, it adds a much more moderate amount. In fact, with the reference level set to -15 and the main volume set to -15, DEQ does absolutely nothing to your main channels. If you measure at full reference level, you'll find DEQ only will subtract from your bass level.
Here is another set of measurements I took at -20 MV:
View attachment 228800
Secondly, very, very few people after an Audyssey calibration end up with a large boost in the bass as you have unless they crank up their sub level afterward (which is very common to do). Most are left with very flat bass in which case the DEQ needs to add quite a bit just to get up to the level of the Harman curve you show. It's pretty widely known that if you crank up your sub level after calibrating, you may want to minimize the use of the DEQ as the two combined may be too much.
Personally, I have my target curve set with the bass boost wanted already in it and so when I do use the DEQ I typically keep it at -15 Ref setting since most of the time when I care about sound quality I average around a -15 main volume level--which means it's doing nothing most of the time to the main channels. Other than that, it can be a useful/quick/easy "tone control" by adjusting the Ref Level Offset.
Though I do agree and am annoyed by the change to the surround level as Matt mentioned (to get back to the subject of the thread) and would really like it if they changed that.
And no, the sub isn't causing the high frequency slope/rolloff in your measurements. That's quite impossible as the highest low-pass one can have on a D&M is 250 Hz. The sub is always low-passed.
As to your contention the base-level Audyssey amounts to an FIR with only two taps, that's quite unbelievable and unsupported, especially when Audyssey is saying something much different. It has been so long since I used the base level version I don't think I even had measuring equipment back then so I have no measurements to share, but I do remember seeing plenty of others that would show that clearly wasn't the case.
I was quite astounded just how much resolution XT32 was capable of when I started manually shaping it with control points using the App. These days with MultEQ-X, they let you see it. Here's an example:
View attachment 228804
And yes, all those little squiggles actually are doing something. I don't know enough about FIR filters to eyeball that and estimate the equivalent number of taps one would need to duplicate it with other software, so I'll leave those estimations to others.

")