How would you analyze a track to see the low frequency extension? Thanks.
Audcaity, import the song, select the portion of the song, and Plot Spectrum.
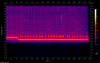
While audacity is somewhat easy, if you actually want a clear and detailed view of bass that you can follow on a timeline - sox for the win:
-
yt-dlp (optionally, to download audio from Youtube)
-
ffmpeg (optionally to convert stuff to wav/flac)
-
sox (for spectogram, can read some formats directly, wav/flac/ogg..)
All of these can be used on Windows, Linux and Mac.
Example command to download tubes:
Code:
yt-dlp -x --audio-format wav --restrict-filenames "https://www.youtube.com/watch?v=xxxxx"
Example spectrogram command (results in spectrogram.png):
Code:
sox input.wav -n remix - rate 200 spectrogram -z 60
(I've use -z 60 scale which is quite good to show somewhat audible levels... you can replace "rate 200" with double the hz you want to see up to..)
Complete Windows scripts for easy Youtube command line automation:
Code:
REM Save this script as yt_spectrogram.cmd
REM Call it with complete URL as argument: yt_spectrogram "https://www.youtube.com/watch?v=xxxxx"
REM It will automatically call spectrogram.cmd and create Filename_From_Youtube.png
@yt-dlp -x --restrict-filenames --no-mtime --audio-format wav --exec spectrogram.cmd %1
Code:
REM Save this script as spectrogram.cmd
REM yt_spectrogram.cmd will call this, or you can use it standalone: spectrogram.cmd "file.wav"
@"C:\Program Files (x86)\sox-14-4-2\sox" %1 -n remix - rate 200 spectrogram -z 60
@move spectrogram.png "%~n1.png"
@echo READY: %~n1.png
Complete Linux (and maybe Mac) scripts for easy Youtube command line automation:
Code:
# Save this script as yt_spectrogram.sh
# Call it with complete URL as argument: yt_spectrogram.sh "https://www.youtube.com/watch?v=xxxxx"
# It will automatically call spectrogram.sh and create Filename_From_Youtube.png
yt-dlp -x --restrict-filenames --no-mtime --audio-format wav --exec ./spectrogram.sh "$1"
Code:
# Save this script as spectrogram.sh
# yt_spectrogram.sh will call this, or you can use it standalone: spectrogram.sh "file.wav"
sox "$1" -n remix - rate 200 spectrogram -z 60
mv -f spectrogram.png "${1%.wav}.png"
echo "READY: ${1%.wav}.png"
Another SendTo-automation tip on Windows, check @sweetchaos 's guide:
Spectrum from Falcon Heavy recording, above: About -20dB/decade from 10 to 1000Hz, then -30dB from 1k to 10kHz. I'd wager it doesn't really roll off below 10Hz as shown. --- Acoustic/infrasonic rocket engine signatures https://ui.adsabs.harvard.edu/abs/2003SPIE.5090...30T/abstract...

audiosciencereview.com
A rare example of actual loud ~25hz content in music, hear Roddy Ricch - The Box, the whole album is full of nice bass:
![Roddy Ricch - The Box [Official Music Video]-UNZqm3dxd2w.png](https://audiosciencereview.com/forum/data/attachments/122/122900-f79fdb0c8f763cfd6d26a19eaef0c886.jpg "Roddy Ricch - The Box [Official Music Video]-UNZqm3dxd2w.png")
For some actual loud bass, the level should be atleast near -20dB. It's already rarer to see around -10dB.. check Roddy's tracks Peta or Bacc Seat..
![Roddy Ricch - Peta (feat. Meek Mill) [Official Audio]-Jd6q69hO6X4.png](https://audiosciencereview.com/forum/data/attachments/122/122902-bf40c607fc3fcbab8d1526f115489567.jpg "Roddy Ricch - Peta (feat. Meek Mill) [Official Audio]-Jd6q69hO6X4.png")

")