• WANTED: Happy members who like to discuss audio and other topics related to our interest. Desire to learn and share knowledge of science required. There are many reviews of audio hardware and expert members to help answer your questions. Click here to have your audio equipment measured for free!

Any Picoscope 4262 users here? Help !

Music1969

Major Contributor
Joined
Feb 19, 2018
Messages
4,676
Likes
2,849
Hi all.

I'm looking to verify that I am using the Picoscope properly.

I have a SMSL D-6 DAC which Amir has measured. I'm not expecting the Pico have anywhere near the resolution as the APx555 (obviously).


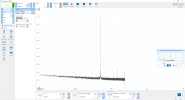
But why is this THD+N and SNR so low in 'Spectrum' view but when I just switch to 'Scope view', the same measurement looks a bit more as expected ?

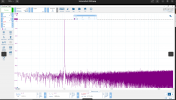
Spectrum view, THD+N and SNR at 54dBc (strangely low):
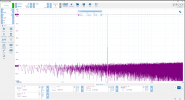
1682865557147.png

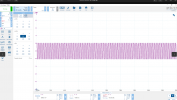
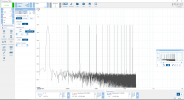
Just switching to scope view, THD+N = 84dBc
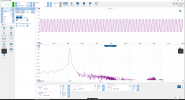
1682865611923.png


As mentioned I don't expect to see SINAD of 113 dB like Amir found but there is huge difference between 54dBc and 84dBc

I'm obviously doing something wrong somewhere
 

Dippedinfrequency

New Member
Joined
Apr 30, 2023
Messages
1
Likes
1
Hi looking at your screenshots:

Sample rate spectrum: 100kS/s

Sample rate scope: 10MS/s

Haven’t used my pico in quite some years but I remember having similar issues when toggling their views.


Hope that brings some you to some clarity .
 

DonH56

Master Contributor
Technical Expert
Forum Donor
Joined
Mar 15, 2016
Messages
7,906
Likes
16,732
Location
Monument, CO
Sampling rate and FFT bandwidth, number of points are all very different for the two plots. You are comparing a plot of 50 kHz bandwidth at 100 kS/s and 131,072 points to one of 5 MHz bandwidth at 10 MS/s and 1M points. I don't have a Picoscope so can't say how other things like noise floor and processing gain might vary between the two, but I would not expect them to match.
 
OP
M

Music1969

Major Contributor
Joined
Feb 19, 2018
Messages
4,676
Likes
2,849
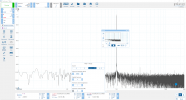
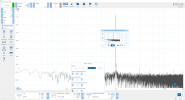
@Dippedinfrequency @DonH56 I had been lazy with earlier screenshots. I had tried matching sample rates etc.

Still huge difference in THD+N between the views : 57dBc vs 72dBc

See below
1682868331078.png

1682868355313.png
 

DonH56

Master Contributor
Technical Expert
Forum Donor
Joined
Mar 15, 2016
Messages
7,906
Likes
16,732
Location
Monument, CO
Number of samples vs. number of bins is still different which will change the noise floor. There are many variables and I do not know them, not being a PicoScope owner, so hopefully an owner will chime in. Last time I used a PicoScope (many years ago) they were pretty responsive; have you asked them what is going on?
 
OP
M

Music1969

Major Contributor
Joined
Feb 19, 2018
Messages
4,676
Likes
2,849
Even SNR looks way off, just eyeballing it

In spectrum view, SNR is same as THD+N at 57dBc
 
OP
M

Music1969

Major Contributor
Joined
Feb 19, 2018
Messages
4,676
Likes
2,849
Number of samples vs. number of bins is still different which will change the noise floor.
I can make out at 1M bins which is the max

And still get same THD+N and SNR both at 57dBc, in spectrum view

SNR should be better than 80dB , just eyeballing the spectrum plot
 

DonH56

Master Contributor
Technical Expert
Forum Donor
Joined
Mar 15, 2016
Messages
7,906
Likes
16,732
Location
Monument, CO
Even SNR looks way off, just eyeballing it

In spectrum view, SNR is same as THD+N at 57dBc

If the THD+N is noise-limited then SNR and THD+N will be the same. It looks like a bit of 3HD showing up in the plot but overall the noise energy is dominating.

I have used 'scopes from $300 to $750k+ and they all do different and often unexpected things when generating spectral (FFT) plots. If the manual does not help, ping PicoScope and ask them what the heck is going on. Could be a bug in their SW or how they set up the different FFTs. From afar we are just speculating. Maybe ping @pma since I think he uses PicoScope?
 
OP
M

Music1969

Major Contributor
Joined
Feb 19, 2018
Messages
4,676
Likes
2,849
If the THD+N is noise-limited then SNR and THD+N will be the same. It looks like a bit of 3HD showing up in the plot but overall the noise energy is dominating.

I have used 'scopes from $300 to $750k+ and they all do different and often unexpected things when generating spectral (FFT) plots. If the manual does not help, ping PicoScope and ask them what the heck is going on. Could be a bug in their SW or how they set up the different FFTs. From afar we are just speculating. Maybe ping @pma since I think he uses PicoScope?

I managed to push noise floor lower, to actually show distortion products now

These SNR and THD+N values don't look right hey? Something off here.

I haven't contacted Pico yet.

1682871699008.png
 
OP
M

Music1969

Major Contributor
Joined
Feb 19, 2018
Messages
4,676
Likes
2,849
Found this video by Pico - looks like they use the scope view (and add spectrum, rather than starting with spectrum instrument) as the basis for THD+N and SNR measurements

Like I showed above with the better THD+N


pma

Major Contributor
Joined
Feb 23, 2019
Messages
4,608
Likes
10,778
Location
Prague
If the THD+N is noise-limited then SNR and THD+N will be the same. It looks like a bit of 3HD showing up in the plot but overall the noise energy is dominating.

I have used 'scopes from $300 to $750k+ and they all do different and often unexpected things when generating spectral (FFT) plots. If the manual does not help, ping PicoScope and ask them what the heck is going on. Could be a bug in their SW or how they set up the different FFTs. From afar we are just speculating. Maybe ping @pma since I think he uses PicoScope?
The important issue is absence of anti-aliasing input filters in those digital scopes. This is because you have very wide range of sampling frequencies and implementation of a proper anti- aliasing filter for every sampling frequency would be difficult. Try to start with high sampling rate and observe the spectrum. If you see spuriae moving in frequency down when sampling frequency is lowered, then it is the alias/aliases. For a fixed sampling frequency, you may build your own anti- aliasing analog filter. As everything, it is not only plug and play.
 
OP
M

Music1969

Major Contributor
Joined
Feb 19, 2018
Messages
4,676
Likes
2,849
@pma can you please share your 4262 settings, for measuring DAC THD+N ? So that I can try to reproduce

I am only interested in THD+N in the 20-20kHz region

So even if select a high enough sampling rate to push aliasing imaging - is there a way to set the THD+N region for only 20-20kHz ?

Like can be done in REW. I can sample at PCM705kHz in REW and set THD+N for only 20-20kHz

Screenshots of all your settings in Picoscope would help me tremendously
 
Last edited:

DonH56

Master Contributor
Technical Expert
Forum Donor
Joined
Mar 15, 2016
Messages
7,906
Likes
16,732
Location
Monument, CO
Post #4 has different number of samples, but the same sampling rate, so aliasing should not explain (all) the problem...
 
OP
M

Music1969

Major Contributor
Joined
Feb 19, 2018
Messages
4,676
Likes
2,849
Post #4 has different number of samples, but the same sampling rate, so aliasing should not explain (all) the problem...
Yes I'm hoping there is a Pico 4262 user out that can simply share all their settings for measuring DAC's THD+N

And then I can just copy to try and reproduce

For analysing THD+N in 20-20kHz region I trust there will be a standard group of settings or 'best practice'

This DAC does noise shaping past 20kHz so I wonder if that is limiting both SNR and THD+N...

I can't seem to set the measurements to 20-20kHz region, like can simply be done in REW for example

In REW I can measure at PCM705kHz with an ADC but still ask it to calc THD+N for any sub-range I specify

I suspect this might be the issue here.

But simply changing the range to 20kHz still doesn't solve it
 

DonH56

Master Contributor
Technical Expert
Forum Donor
Joined
Mar 15, 2016
Messages
7,906
Likes
16,732
Location
Monument, CO
I do not know about the PicoScope. Generally the 'scope's FFT bandwidth and resolution is set by the sampling rate and number of samples (time captured), then it is up to the SW for any additional processing including filtering and such. The SW may let you limit the bandwidth; be sure to oversample enough to avoid aliasing in that case. (The DSOs I used at work allowed significant post-processing but in all cases avoidance/suppression of aliasing is on the user.) As @pma said, DSOs do not not usually include analog input filters, so you may need to add one before the 'scope.

REW is focused on audio analysis so has many more features than a DSO, natch. You can buy various FW/SW packages targeting specific applications for many 'scopes. I do not know what if any are available for PicoScope models (some may be third-party, or target specific languages like Python, to allow you to write your own).
 
OP
M

Music1969

Major Contributor
Joined
Feb 19, 2018
Messages
4,676
Likes
2,849
I do not know about the PicoScope. Generally the 'scope's FFT bandwidth and resolution is set by the sampling rate and number of samples (time captured), then it is up to the SW for any additional processing including filtering and such. The SW may let you limit the bandwidth; be sure to oversample enough to avoid aliasing in that case. (The DSOs I used at work allowed significant post-processing but in all cases avoidance/suppression of aliasing is on the user.) As @pma said, DSOs do not not usually include analog input filters, so you may need to add one before the 'scope.

REW is focused on audio analysis so has many more features than a DSO, natch. You can buy various FW/SW packages targeting specific applications for many 'scopes. I do not know what if any are available for PicoScope models (some may be third-party, or target specific languages like Python, to allow you to write your own).

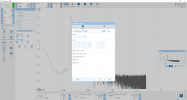
I''ve now enabled the 'math channels' function with a 'band pass' filter, so I can get THD+N for just a range I want (like I do with REW)

Here I have it for 15Hz to 24kHz

Now I have another problem - THD+N and SNR better than -120dBc :D

So my issue has completely flipped and I can't work out why.

So i can't really trust the numbers at all.

There is no way SNR can be so much better than the noise floor !

And no way the Pico 4262 ADC itself has THD+N down to -120dB?

I do have the 20bit enhanced vertical resolution enabled

Any help @pma ?

This DAC I am measuring is SMSL D-6 measured by Amir here: here

Screenshot (255).pngScreenshot (257).pngScreenshot (259).pngScreenshot (260).pngScreenshot (261).pngScreenshot (262).pngScreenshot (263).pngScreenshot (264).pngScreenshot (265).pngScreenshot (266).png
 

DonH56

Master Contributor
Technical Expert
Forum Donor
Joined
Mar 15, 2016
Messages
7,906
Likes
16,732
Location
Monument, CO
I would guess the 20-bit option incorporates averaging that suppresses the noise.

Is there some reason you don't just use REW instead? Keeping the 'scope for time-domain analysis, which is its forte.
 
OP
M

Music1969

Major Contributor
Joined
Feb 19, 2018
Messages
4,676
Likes
2,849
I would guess the 20-bit option incorporates averaging that suppresses the noise.

Is there some reason you don't just use REW instead? Keeping the 'scope for time-domain analysis, which is its forte.
I have the Pico for other use. And of course I use REW already.

But Pico should "work" to give accurate figures

I guess that is what I am trying to solve here
 

pkane

Master Contributor
Forum Donor
Joined
Aug 18, 2017
Messages
5,703
Likes
10,394
Location
North-East
I''ve now enabled the 'math channels' function with a 'band pass' filter, so I can get THD+N for just a range I want (like I do with REW)

Here I have it for 15Hz to 24kHz

Now I have another problem - THD+N and SNR better than -120dBc :D

So my issue has completely flipped and I can't work out why.

So i can't really trust the numbers at all.

There is no way SNR can be so much better than the noise floor !

And no way the Pico 4262 ADC itself has THD+N down to -120dB?

I do have the 20bit enhanced vertical resolution enabled

Any help @pma ?

This DAC I am measuring is SMSL D-6 measured by Amir here: here

View attachment 283093View attachment 283094View attachment 283095View attachment 283096View attachment 283097View attachment 283098View attachment 283099View attachment 283100View attachment 283101View attachment 283102

Any reason you're measuring at 1MHz scale? Can you adjust the bandwidth to be closer to the 24kHz range? FFT frequency resolution is based on the number of bins (FFT size) and bandwidth. The greater the bandwidth for same size FFT, the lower the frequency resolution, the less precise any measurement of individual components, such as harmonic distortion or noise.
 
Top Bottom